Stock Market Outlook for February 9, 2026

From Growth to Grit: Navigating the Late-Winter Market Shift
*** Stocks highlighted are for information purposes only and should not be considered as advice to purchase or to sell mentioned securities. As always, the use of technical and fundamental analysis is encouraged in order to fine tune entry and exit points to average seasonal trends.
Stocks Entering Period of Seasonal Strength Today:
Subscribers Click on the relevant link to view the full profile. Not a subscriber? Signup here.
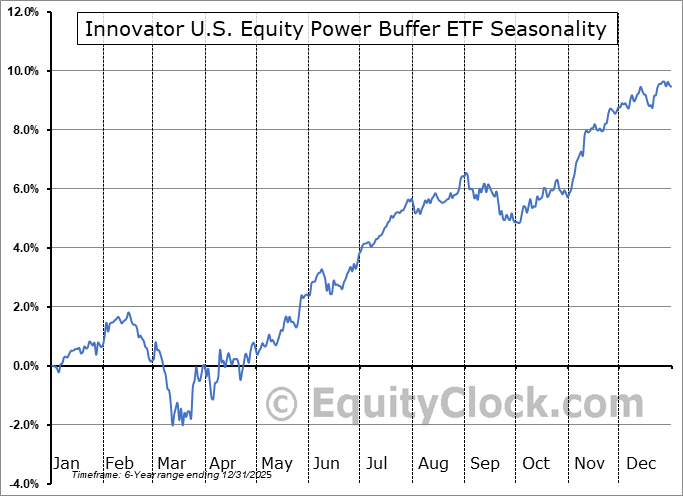
Innovator U.S. Equity Power Buffer ETF (AMEX:PSEP) Seasonal Chart

Breakwave Dry Bulk Shipping ETF (AMEX:BDRY) Seasonal Chart

Vident International Equity Fund (AMEX:VIDI) Seasonal Chart
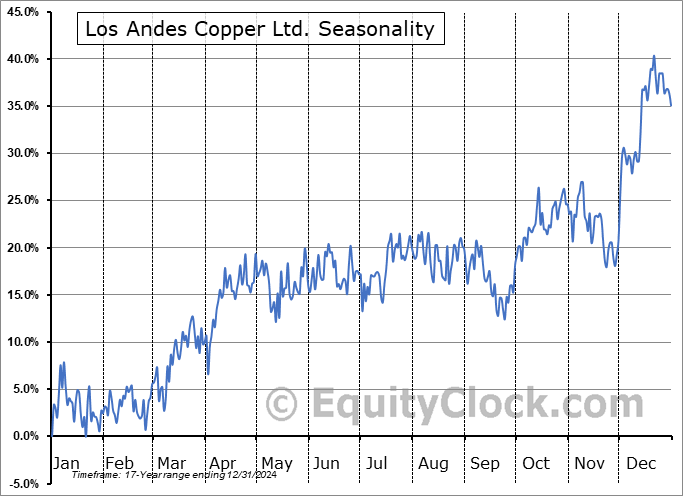
Los Andes Copper Ltd. (TSXV:LA.V) Seasonal Chart

Brown-Forman Corp. – Class A (NYSE:BF/A) Seasonal Chart

Vanguard Global Minimum Volatility ETF (TSE:VVO.TO) Seasonal Chart

General Mills Inc. (NYSE:GIS) Seasonal Chart

Ero Copper Corporation (TSE:ERO.TO) Seasonal Chart

Equinor ASA (NYSE:EQNR) Seasonal Chart

Baytex Energy Corp. (NYSE:BTE) Seasonal Chart

Healthcare Leaders Income ETF (TSE:HHL.TO) Seasonal Chart

iShares MSCI Hong Kong ETF (NYSE:EWH) Seasonal Chart

GSK Plc (NYSE:GSK) Seasonal Chart

iShares MSCI Eurozone ETF (NYSE:EZU) Seasonal Chart
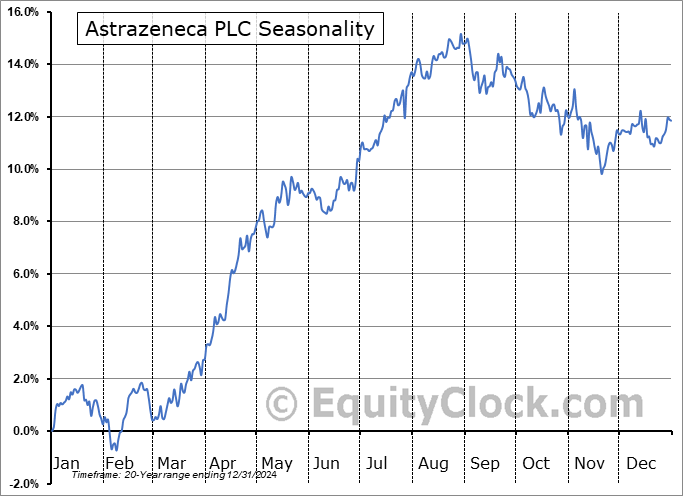
Astrazeneca PLC (NASD:AZN) Seasonal Chart

SPDR SSGA US Large Cap Low Volatility Index ETF (AMEX:LGLV) Seasonal Chart

SPDR S&P Global Dividend ETF (AMEX:WDIV) Seasonal Chart

Consumer Staples Select Sector SPDR Fund (NYSE:XLP) Seasonal Chart

Royal Gold, Inc. (NASD:RGLD) Seasonal Chart

Iridium Communications Inc. (NASD:IRDM) Seasonal Chart

Canadian Natural Resources Ltd. (NYSE:CNQ) Seasonal Chart

Cardinal Energy Ltd. (TSE:CJ.TO) Seasonal Chart

iShares Core Aggressive Allocation ETF (NYSE:AOA) Seasonal Chart

Invesco S&P Emerging Markets Low Volatility ETF (AMEX:EELV) Seasonal Chart

SPDR S&P China ETF (NYSE:GXC) Seasonal Chart

Voya Infrastructure, Industrials and Materials Fund (NYSE:IDE) Seasonal Chart
Disclaimer: Comments and opinions offered in this report are for information only. They should not be considered as advice to purchase or to sell mentioned securities. Data offered is believed to be accurate, but is not guaranteed.
The Markets
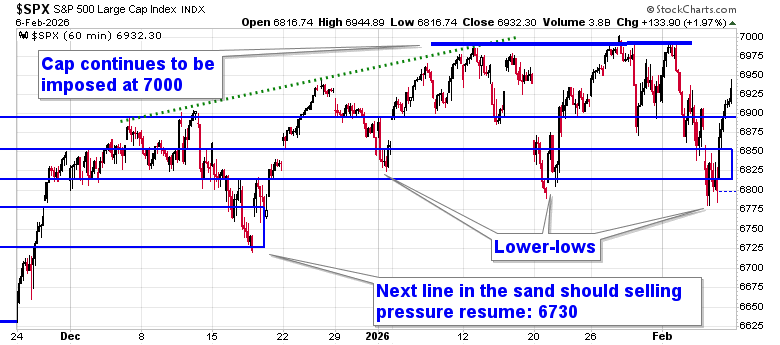
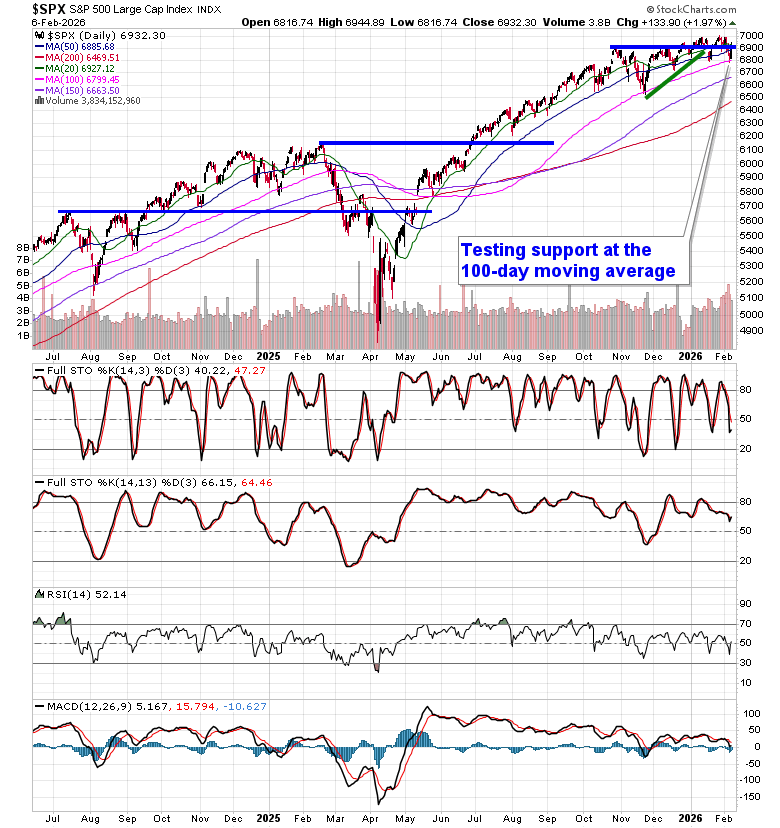
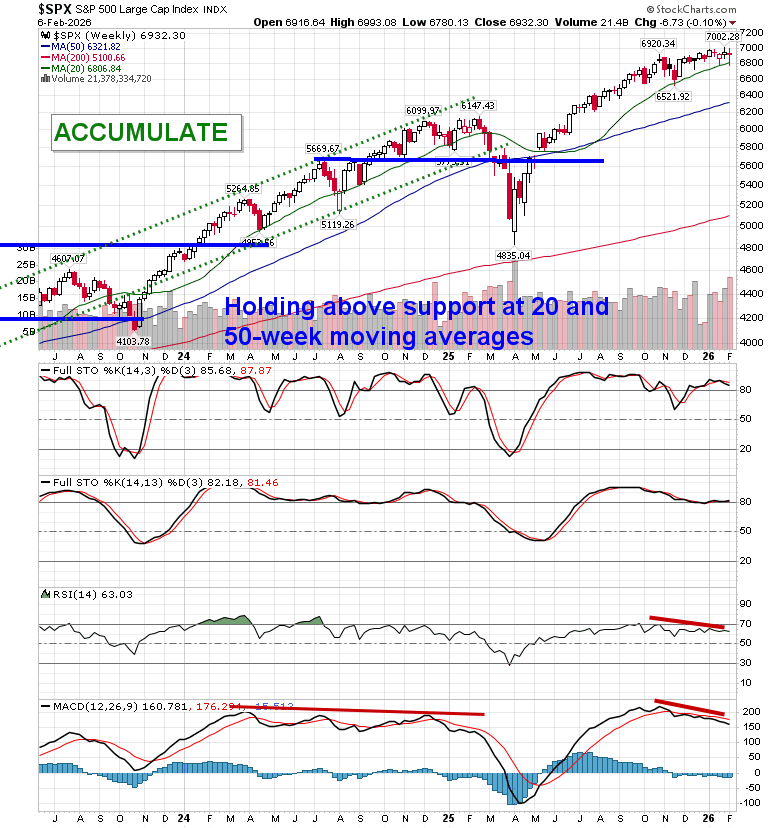
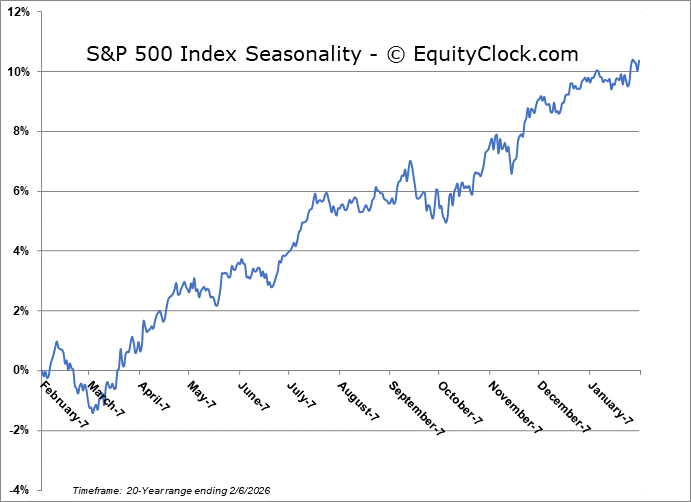
Stocks snapped back on Friday as the cryptocurrency market stabilized following a brutal week for the asset class. The S&P 500 Index jumped by 1.97%, moving back above recent support at 6900. The short term (hourly) chart is showing a slight negative skew as a result of this week’s volatility with highs that have been fixed around 7000 and lower-lows recorded since the year began. Nothing extreme has developed, yet, and the benchmark remains within arm’s reach of the all-time high charted less than two weeks ago. Threats remain for a downside resolution to 6730, or the mid-December lows, particularly through the period of seasonal weakness for stocks that is average later in February. The character of the market seems to have shifted where levels of resistance (at least on this tech heavy benchmark) are holding greater weight than levels of support. Looking to trim equity exposure in this backdrop, until resolved, has become prudent, pulling back the elevated levels of exposure that were held through the Santa Claus rally period and into the first month of the year, bracing for the kind of volatility that is average later in February. In the Seasonal Advantage Portfolio that we manage for clients at CastleMoore, we took action on Thursday to align with the risks that are creeping into the market ahead of the average mid-February peak in stocks, but, we have not been enticed, yet, to abandon our pro-cyclical and commodity oriented stance that has been flourishing this year. Themes in our chart books to either Accumulate or Avoid continue to gear towards the trends that are working and intact, but we will be scrutinizing the weekly charts closely to determine if any changes in some of our favourable views are required.
Today, in our Market Outlook to subscribers, we discuss the following:
- Market Snapback, But Risks Remain
- Weekly Technical Picture
- Growth Exposure Under Pressure
- Positioning: Barbell Approach
- Volatility Outlook
- Canada: Mixed Labour Market Signals
- Sector-Level Labour Strength Supports Portfolio Themes
- Infrastructure & AI-Driven Capital Spending
Subscribers can look for this report in their inbox or by clicking on the following link and logging in: Market Outlook for February 9
Not signed up yet? Subscribe now to receive full access to all of the research and analysis that we publish
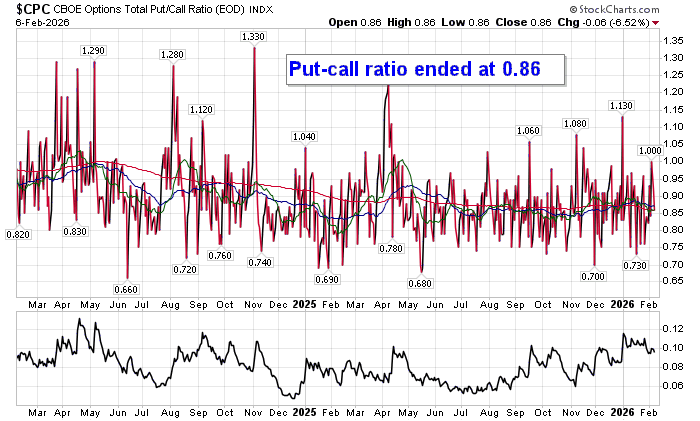
Sentiment on Friday, as gauged by the put-call ratio, ended bullish at 0.86.
Seasonal charts of companies reporting earnings today:


S&P 500 Index
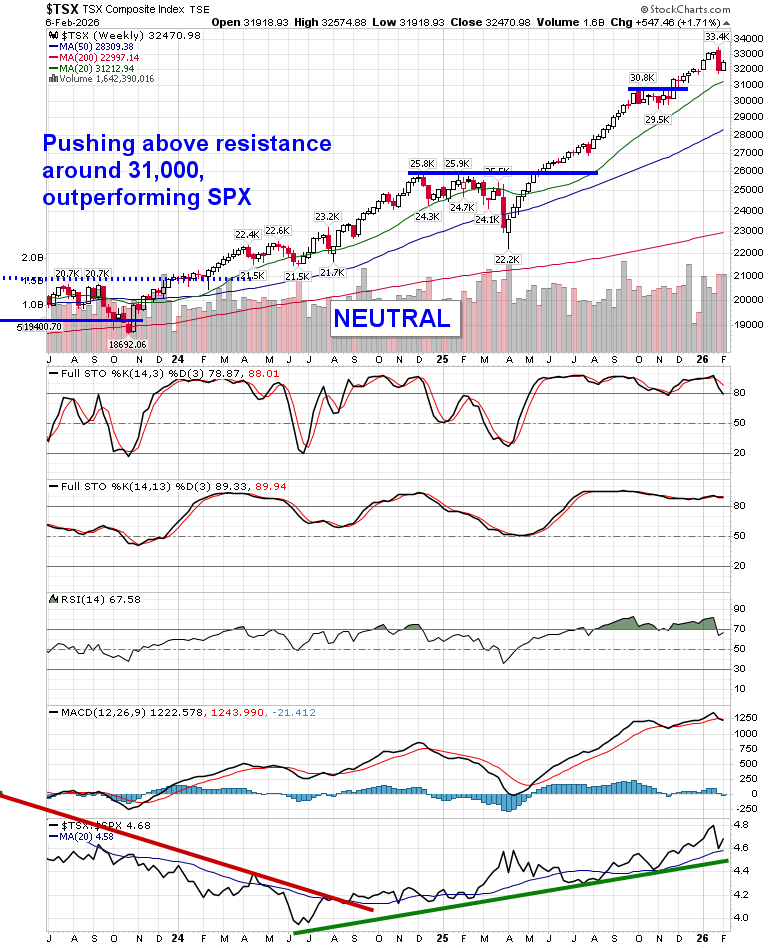
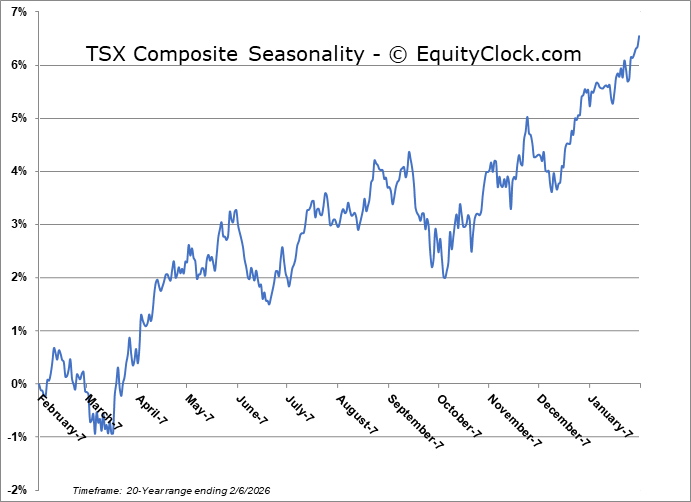
TSE Composite
| Sponsored By... |

|


