Stock Market Outlook for March 4, 2026

Our downside target for the S&P 500 Index at 6730 has been reached: Now what?
*** Stocks highlighted are for information purposes only and should not be considered as advice to purchase or to sell mentioned securities. As always, the use of technical and fundamental analysis is encouraged in order to fine tune entry and exit points to average seasonal trends.
Stocks Entering Period of Seasonal Strength Today:
Subscribers Click on the relevant link to view the full profile. Not a subscriber? Signup here.

Mesa Royalty Tr (NYSE:MTR) Seasonal Chart

Moderna Inc. (NASD:MRNA) Seasonal Chart

ProShares S&P 500 Ex-Financials ETF (AMEX:SPXN) Seasonal Chart
Disclaimer: Comments and opinions offered in this report are for information only. They should not be considered as advice to purchase or to sell mentioned securities. Data offered is believed to be accurate, but is not guaranteed.
The Markets
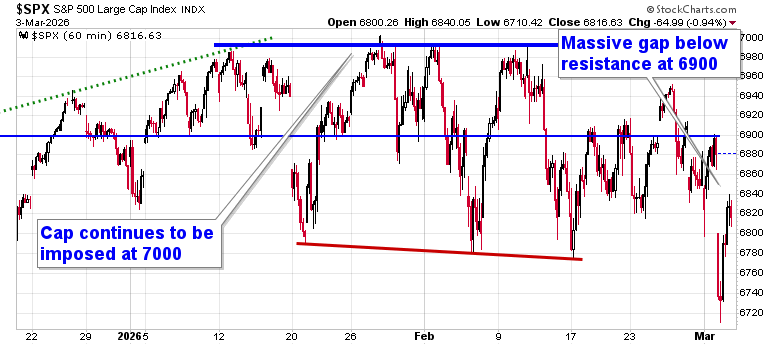
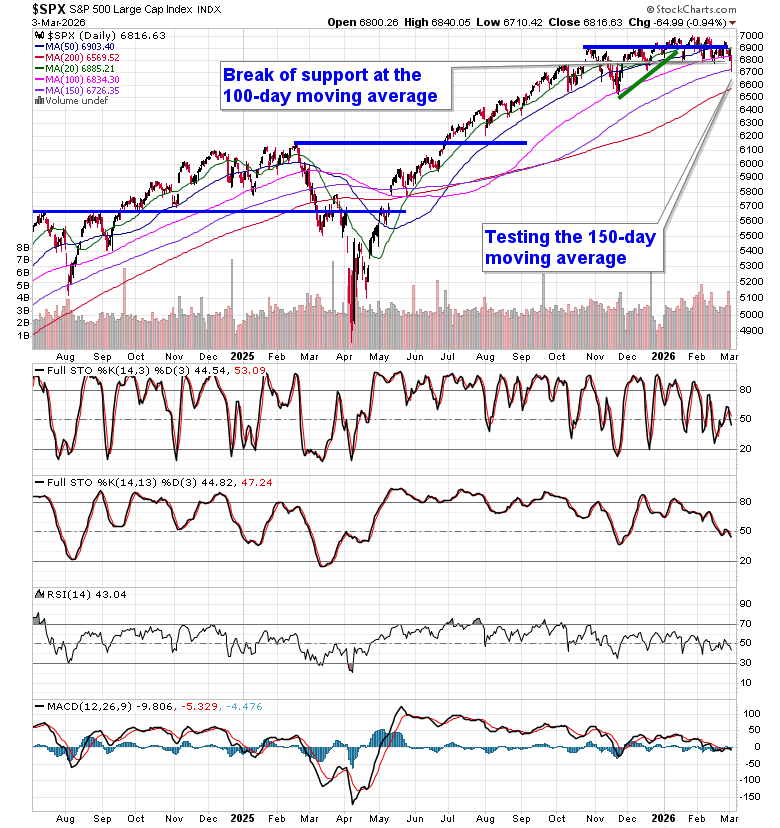
Another volatile session for stocks as traders monitor the threats to energy (oil) as the war with Iran evolves. The S&P 500 Index fell by just over nine-tenths of one percent, opening a substantial gap below the important 6900 pivot point that we have highlighted in our reporting. A gap closure attempt materialized during the session, but the span remains a void on the chart that threatens to present a zone of resistance ahead. Our downside target of 6730, or the mid-December lows, was tested, but with levels of resistance overhead becoming heavier, there is certainly no evidence that selling pressures have concluded. The 100-day moving average for the large-cap benchmark (6834) that was providing significant support has been broken, putting the 150-day and 200-day moving averages in play (6726 and 6569, respectively). A sustained break of horizontal support around 6800 violates an approximately 200-point range from the last few months, proposing a downside target of 6600. In today’s report, we look at a couple of the cues to signal the all-clear to ramp up risk exposure in portfolios again, but we have not reached that point yet. In the Seasonal Advantage Portfolio that we manage for clients at CastleMoore, we have been balancing the near-term risk-reward in the market, barbelling low volatility plays with pro-cyclical/commodity oriented bets. With market correlations high on Tuesday, there was little to provide relief (other than pure commodity bets – eg. DBC), but this barbell approach continues to be viewed as the most appropriate allocation at the present time. Subscribers can view the themes in our chart books to either Accumulate or Avoid that are working and intact.
Today, in our Market Outlook to subscribers, we discuss the following:
- Market Breakdown Intensifies
- Downside Gaps Across Sectors
- Emerging Markets: Sharp Drop But Structural Trend Intact
- Volatility Spikes – Risk-Off Phase Confirmed
- Yields & Dollar: The Critical Tell
- Portfolio Positioning
- Overall Message
Subscribers can look for this report in their inbox or by clicking on the following link and logging in: Market Outlook for March 4
Not signed up yet? Subscribe now to receive full access to all of the research and analysis that we publish
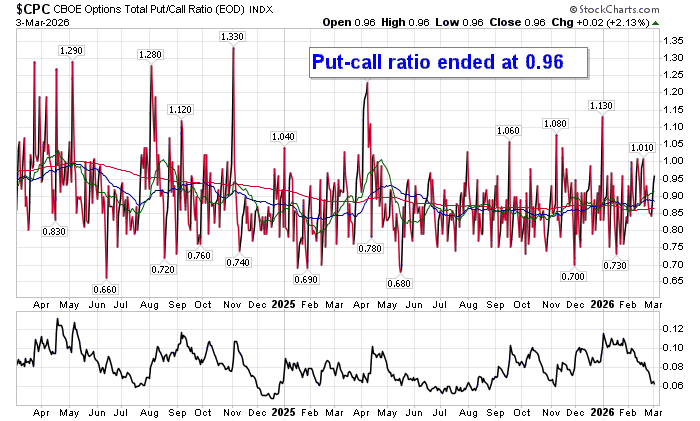
Sentiment on Tuesday, as gauged by the put-call ratio, ended close to Neutral at 0.96.
Seasonal charts of companies reporting earnings today:


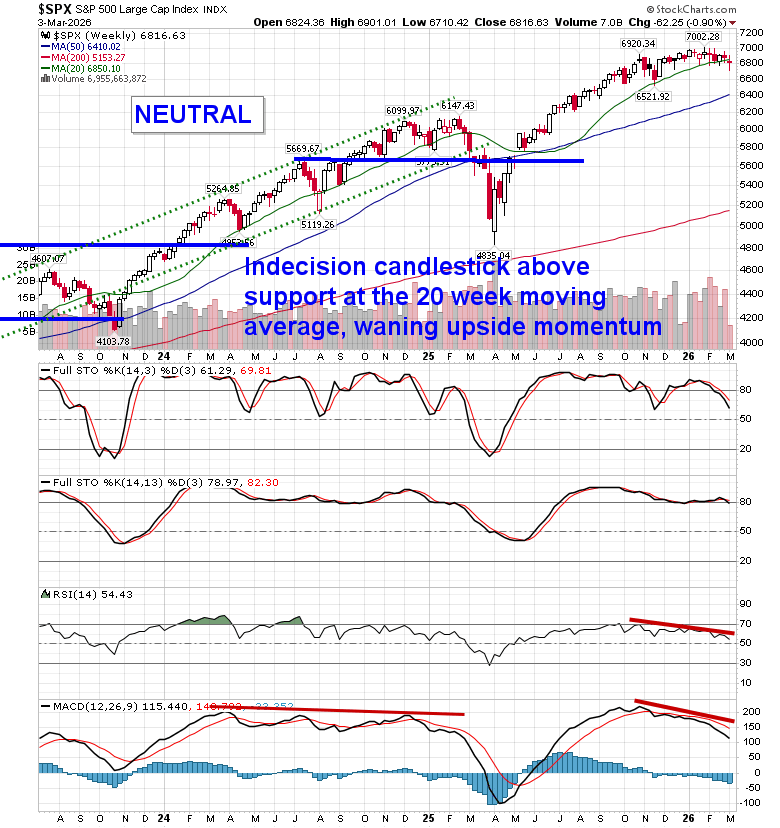
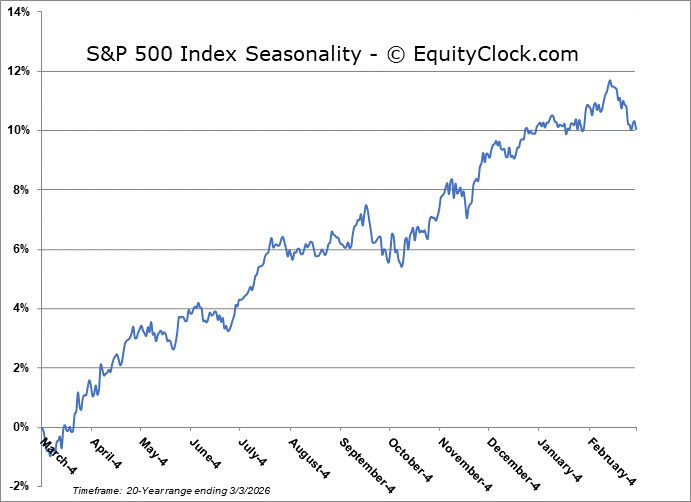
S&P 500 Index
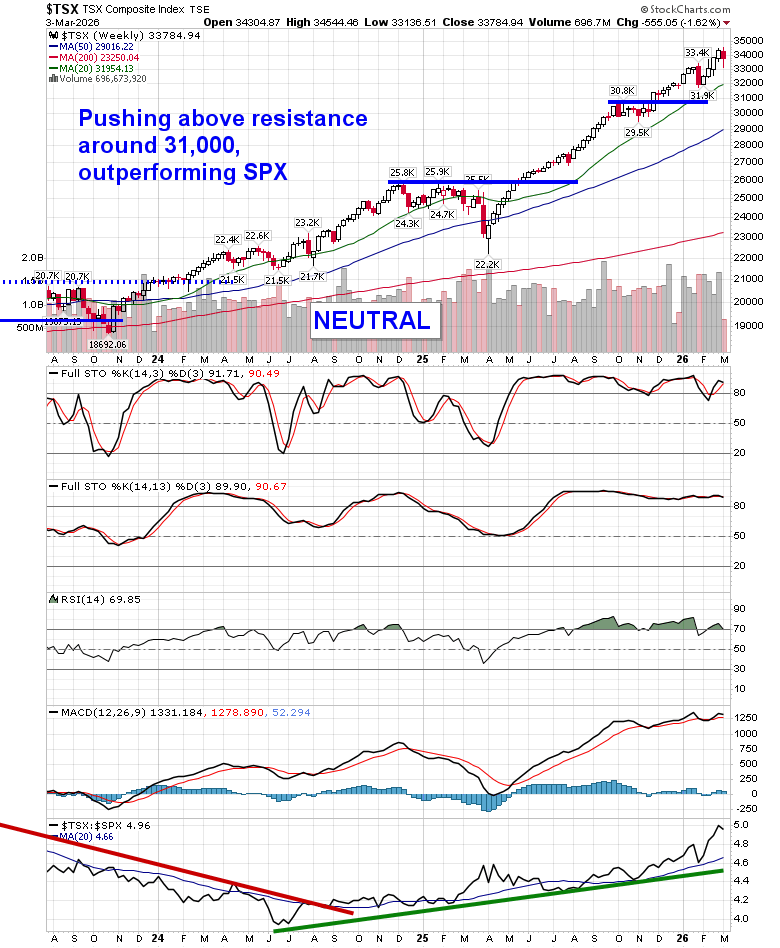
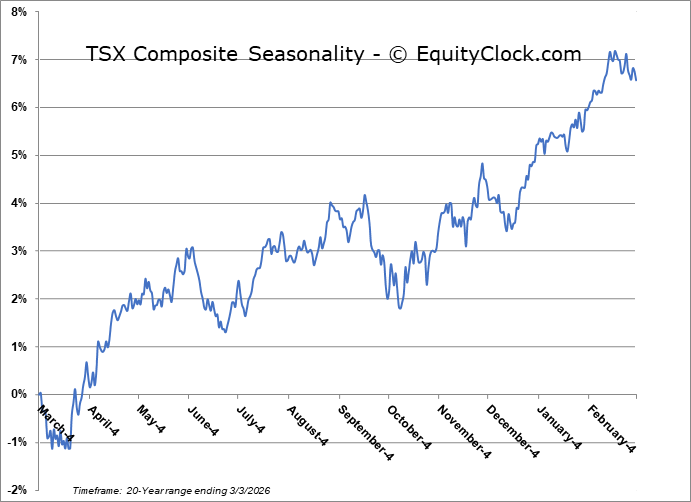
TSE Composite
| Sponsored By... |

|


