Stock Market Outlook for March 30, 2026

From pullback to correction risk, the concerns in the market continue to grow.
*** Stocks highlighted are for information purposes only and should not be considered as advice to purchase or to sell mentioned securities. As always, the use of technical and fundamental analysis is encouraged in order to fine tune entry and exit points to average seasonal trends.
Stocks Entering Period of Seasonal Strength Today:
Subscribers Click on the relevant link to view the full profile. Not a subscriber? Signup here.
Stock Highlight: |
|
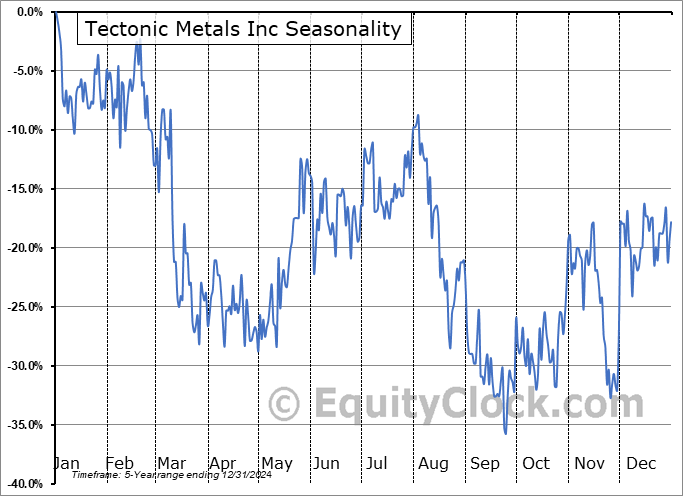
Tectonic Metals Inc (TSXV:TECT.V) Seasonal Chart |
|

Caesars Entertainment, Inc. (NASD:CZR) Seasonal Chart

Meta Platforms, Inc. (NASD:META) Seasonal Chart

Service Corp. (NYSE:SCI) Seasonal Chart

AerCap Holdings NV (NYSE:AER) Seasonal Chart

NN, Inc. (NASD:NNBR) Seasonal Chart
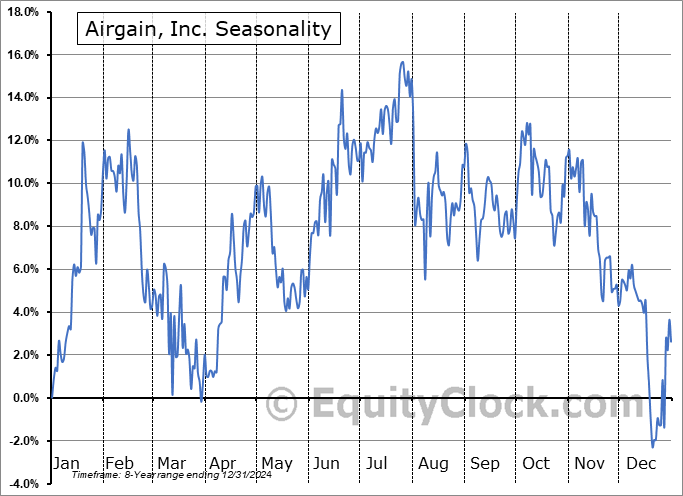
Airgain, Inc. (NASD:AIRG) Seasonal Chart

Summit Midstream Corporation (NYSE:SMC) Seasonal Chart
Tectonic Metals Inc (TSXV:TECT.V) Seasonal Chart

Dawson Geophysical Co. (NASD:DWSN) Seasonal Chart

Key Tronic Corp. (NASD:KTCC) Seasonal Chart

Keyera Corp (TSE:KEY.TO) Seasonal Chart

Calian Group Ltd. (TSE:CGY.TO) Seasonal Chart

Silicon Motion Technology Corp. ADS (NASD:SIMO) Seasonal Chart

Pason Systems, Inc. (TSE:PSI.TO) Seasonal Chart
Disclaimer: Comments and opinions offered in this report are for information only. They should not be considered as advice to purchase or to sell mentioned securities. Data offered is believed to be accurate, but is not guaranteed.
The Markets
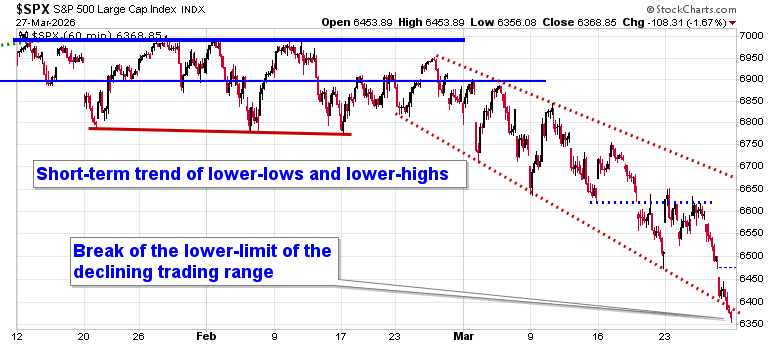
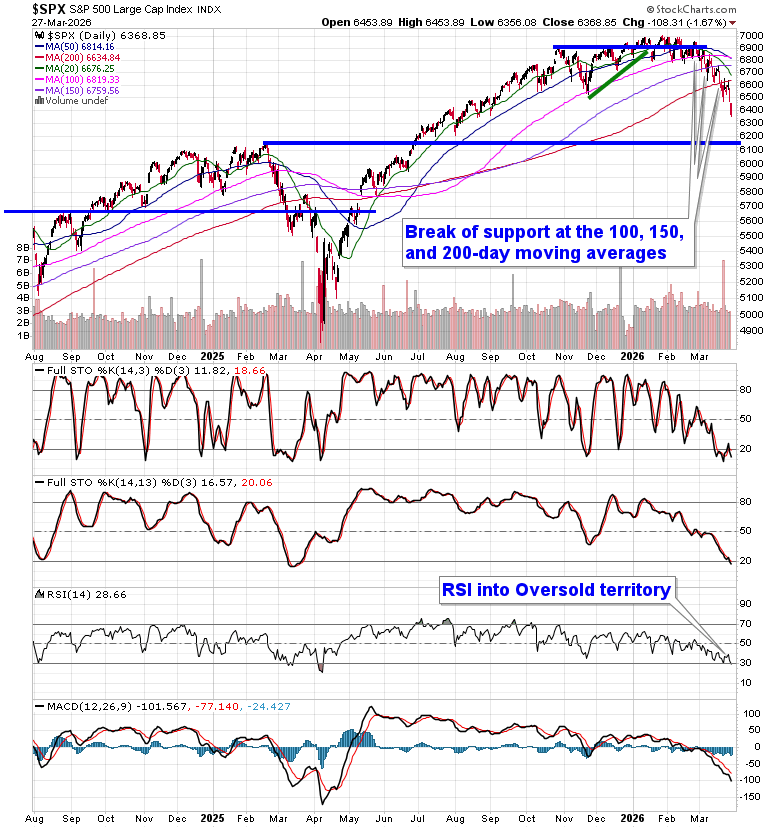
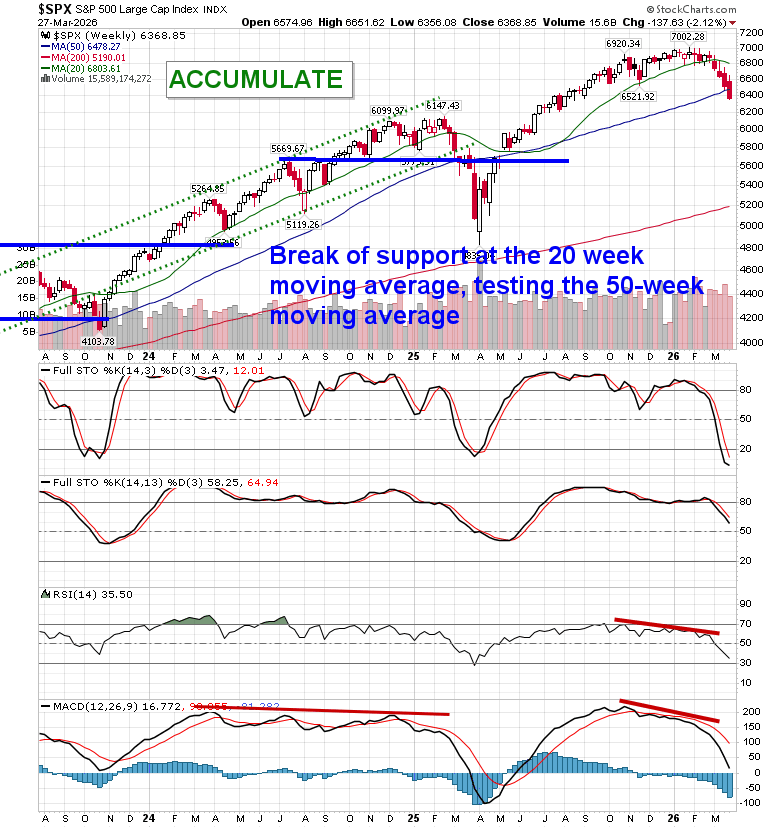
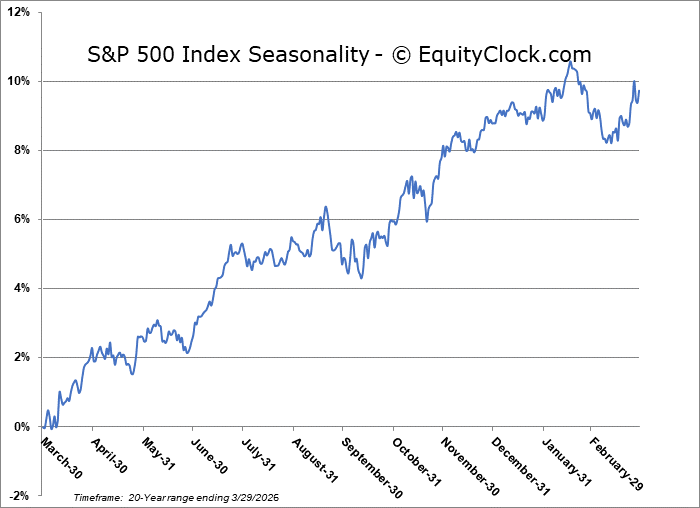
Stocks destabilized again on Friday as the rise in the price of Oil continues to weigh heavy in investor psyches. The S&P 500 Index closed down by 1.67%, moving below the lower limit of the declining trend channel that has been playing out over the past month. The decline is becoming parabolic, highlighting the indiscriminate de-risking that traders are enacting given the uncertainty that surrounds the conflict in Iran. The benchmark is below all major daily moving averages, unable to derive any type of support, and is relying heavily on headlines that remain unpredictable. The benchmark is back into oversold territory with the Relative Strength Index (RSI) below 30, typically a state that coincides with selling exhaustion, albeit within bear market trends. The benchmark is rapidly gravitating towards previous horizontal resistance from early in 2025 at 6100, a hurdle that is now around 250 points away (as of Friday’s lows). As highlighted on Thursday, while the short-term technicals present renewed concern and the longer-term technical profile of the market has become threatening, we still have a focus on the near-term positivity in equity markets heading into the seasonally strong period during the month of April. In the Seasonal Advantage Portfolio that we manage for clients at CastleMoore, we rotated away from our low volatility posture and added to risk exposure a week ago for the seasonally strong window that runs through the next three to five weeks. The conflict in Iran remains a wildcard and we are running down our cues that would warrant a more defensive posture in risk assets, but the net of all developments following Thursday’s and Friday’s action between technicals, fundamentals, and seasonals for the near-term continue to provide the edge to an upside bias. Various investment houses are attesting to the same suggesting a near-term skew based on the risk of the next social media post from the president unleashing a short-covering wave that would be inappropriate to get negative in front of. Subscribers can view the themes in our chart books to either Accumulate or Avoid that we continue to gear portfolios towards.
Today, in our Market Outlook to subscribers, we discuss the following:
- Market Breakdown: From Pullback to Correction Risk
- Oversold… But No Indications of Bottoming (yet)
- Positioning: Staying Risk-On (Tactically)
- Oil: The Core Market Driver
- Structural Shift: Warning Signals Are Triggering
- Technology: Still a Major Drag
- Crypto: A Leading Indicator Continues to Flash Red
- Seasonal & Cycle Context: Playing Out
- Consumer: A Growing Concern
- Credit Markets: Early Warning Signs
Subscribers can look for this report in their inbox or by clicking on the following link and logging in: Market Outlook for March 30
Not signed up yet? Subscribe now to receive full access to all of the research and analysis that we publish
On Thursday, we had the pleasure of presenting to the Canadian Association for Technical Analysis (CATA), speaking on what we are observing in the market according to our process and how to use seasonality to find investment opportunities. The video replay can be viewed through their site at https://www.canadianata.ca/ or subscribers to our service can view the slide deck in the chart database at https://charts.equityclock.com/featured/cata-presentation-march-2026.
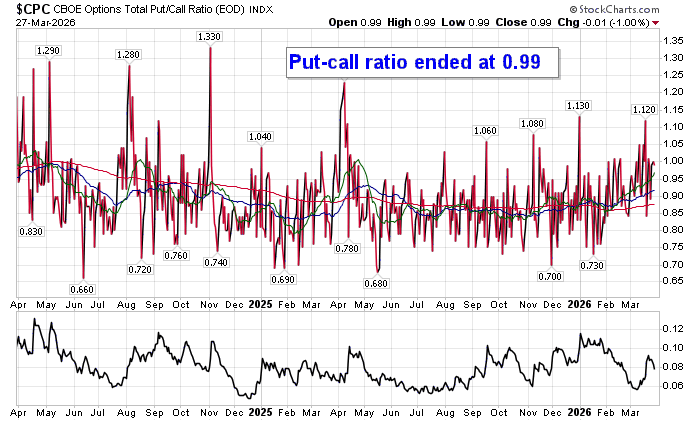
Sentiment on Friday, as gauged by the put-call ratio, ended close to neutral at 0.99.
Seasonal charts of companies reporting earnings today:


S&P 500 Index
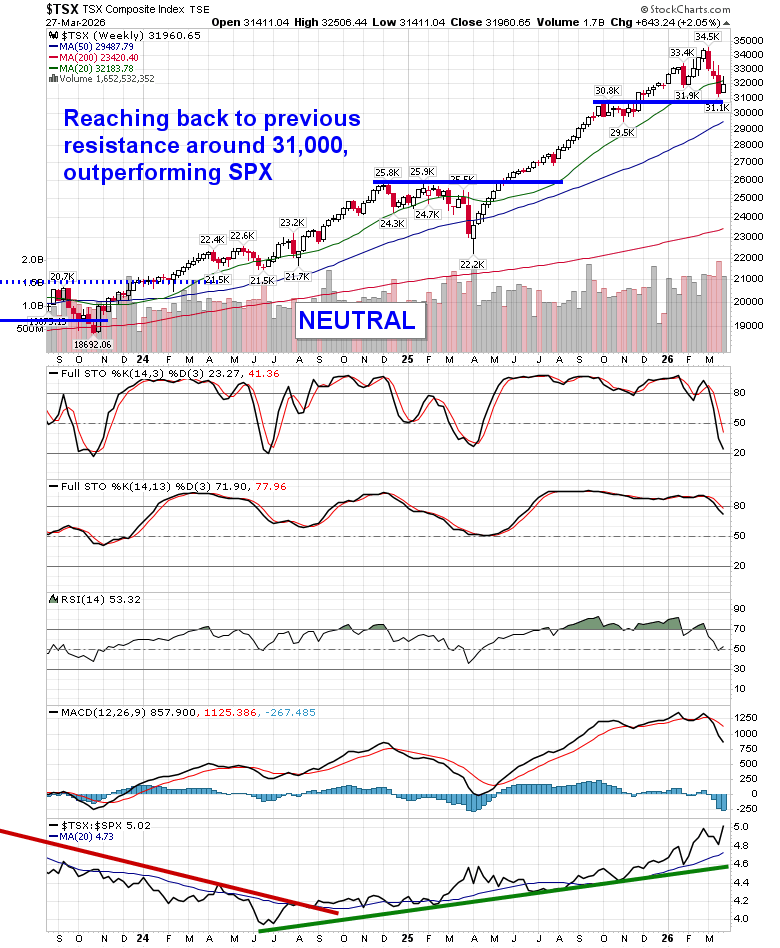
TSE Composite
| Sponsored By... |

|


