Stock Market Outlook for April 1, 2026

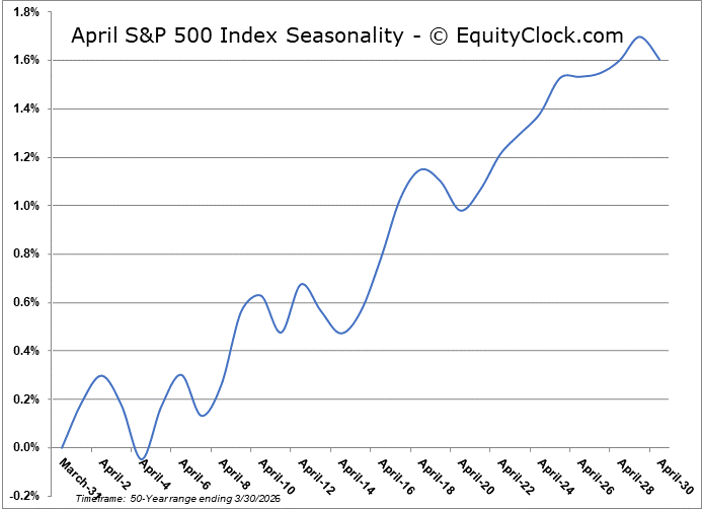
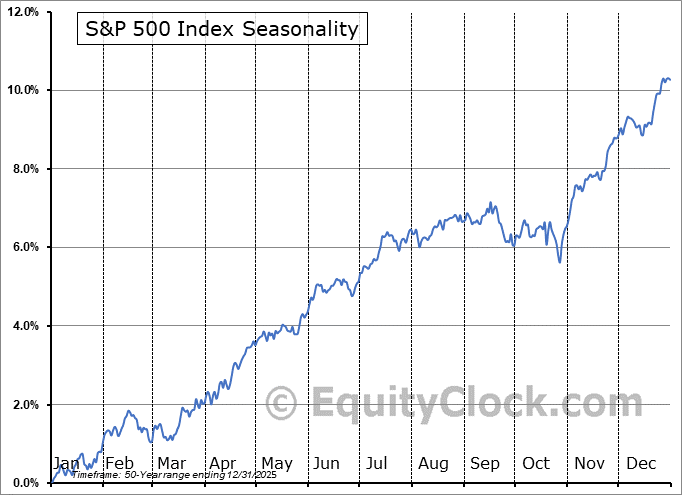
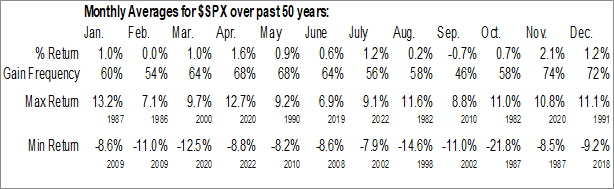
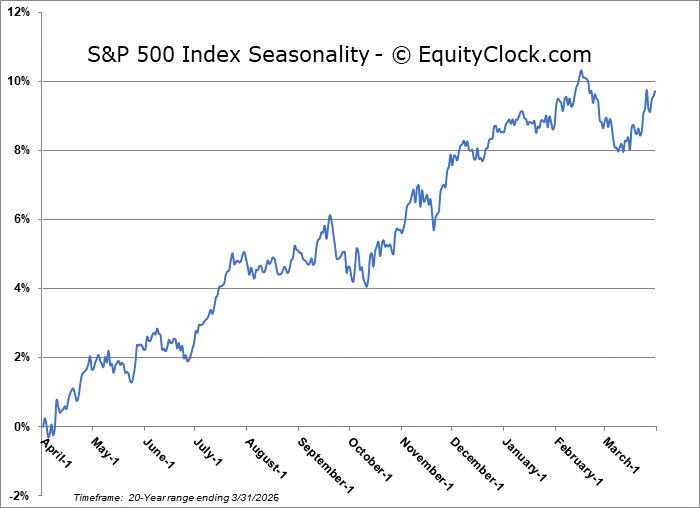
The S&P 500 Index has averaged a return of 1.6% in April with a gain frequency of 68%.
*** Stocks highlighted are for information purposes only and should not be considered as advice to purchase or to sell mentioned securities. As always, the use of technical and fundamental analysis is encouraged in order to fine tune entry and exit points to average seasonal trends.
Stocks Entering Period of Seasonal Strength Today:
Subscribers Click on the relevant link to view the full profile. Not a subscriber? Signup here.
Stock Highlight: |
|

Occidental Petroleum Corp. (NYSE:OXY) Seasonal Chart |
|
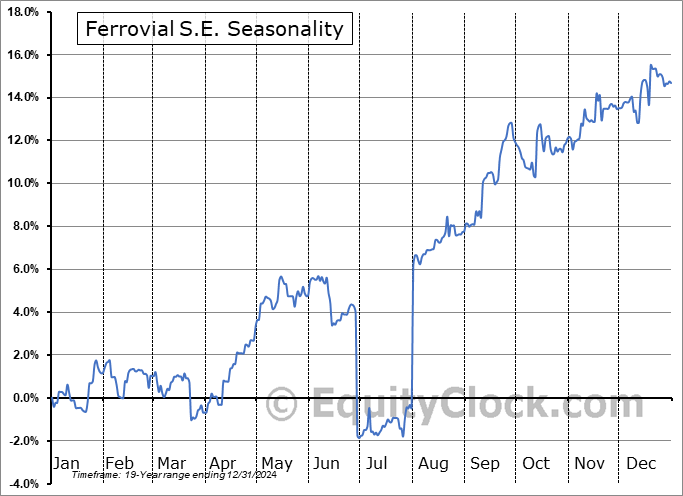
Ferrovial S.E. (NASD:FER) Seasonal Chart

United States Natural Gas Fund (NYSE:UNG) Seasonal Chart
Disclaimer: Comments and opinions offered in this report are for information only. They should not be considered as advice to purchase or to sell mentioned securities. Data offered is believed to be accurate, but is not guaranteed.
The Markets
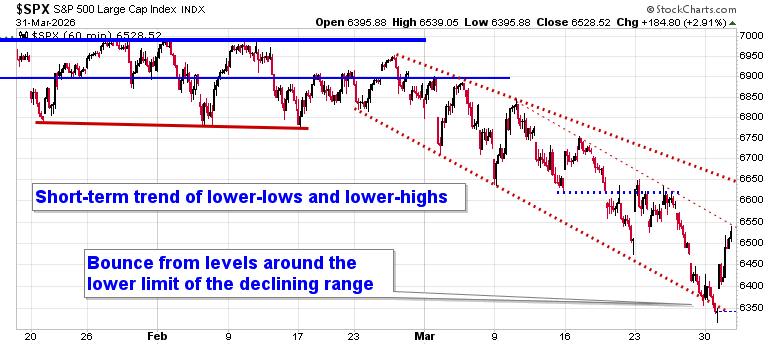
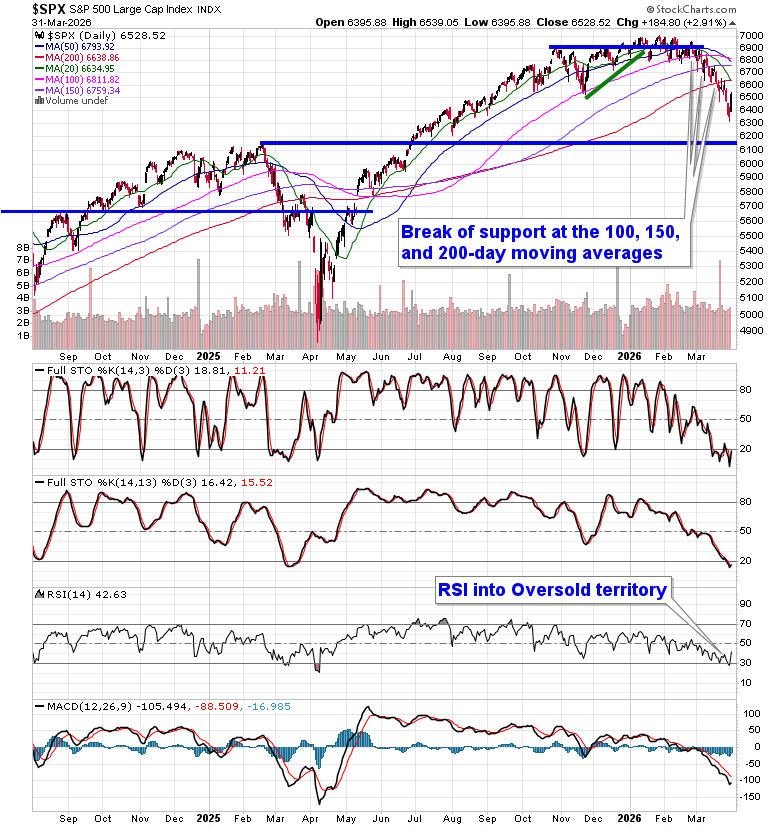
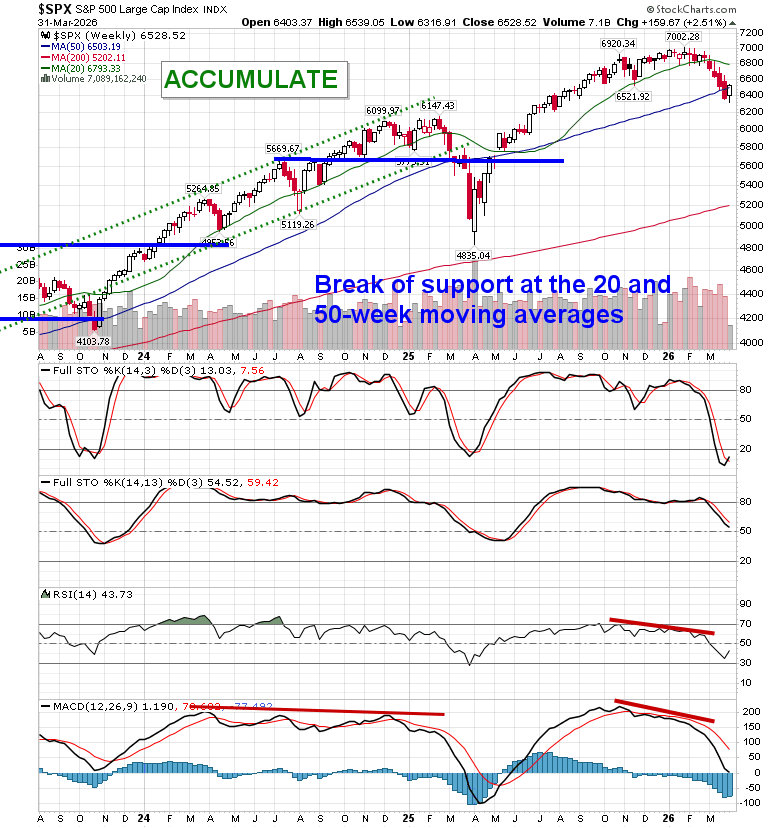
Stocks rallied on Tuesday amidst month/quarter-end portfolio jockeying as headlines pertaining to the conflict in Iran continue to be influential in the day-to-day gyrations. The S&P 500 Index jumped by 2.91%, bouncing from levels around the lower limit of the declining trend channel that has been playing out over the past month. An alleviation of the parabolic decline from recent days is being offered. What make this recovery from the lower limit of its declining span slightly different this time is that the benchmark is not showing the strict respect to levels of resistance that it had shown in recent weeks; the March 27th downside gap around 6475, an implied level of resistance, was broken during the Tuesday rally, and focus now shifts to the horizontal level of resistance that it broke down from on March 23/25 around 6620. The benchmark is still within a short-term trend of lower-highs and lower-lows, as well as below all major daily moving averages, providing some formidable hurdles for the benchmark to overcome heading into the seasonally strong month of April. In the Seasonal Advantage Portfolio that we manage for clients at CastleMoore, we rotated away from our low volatility posture and added to risk exposure just over a week ago for the seasonally strong window that runs through the next two to four weeks. The conflict in Iran remains a wildcard and we are running down our cues that would warrant a more defensive posture in risk assets, but the net of all developments following the action from the past four days between technicals, fundamentals, and seasonals for the near-term continue to provide the edge to an upside bias. Subscribers can view the updated list of themes in our chart books to either Accumulate or Avoid that we continue to gear portfolios towards.
Today, in our Market Outlook to subscribers, we discuss the following:
- Market Action: Strong Bounce within a Declining Short-Term Trend
- Positioning: Tactical Bullish Bias Holds
- Bigger Picture: Ultra-Long-Term Rising Trend for Stocks Still Intact, but Rolling over from the Upper Limit of Prevailing Range
- Seasonality: April Tailwind Is Key
- Seasonal Shift Ahead: Caution Beyond April
- Labor Market: Cracks Beneath the Surface
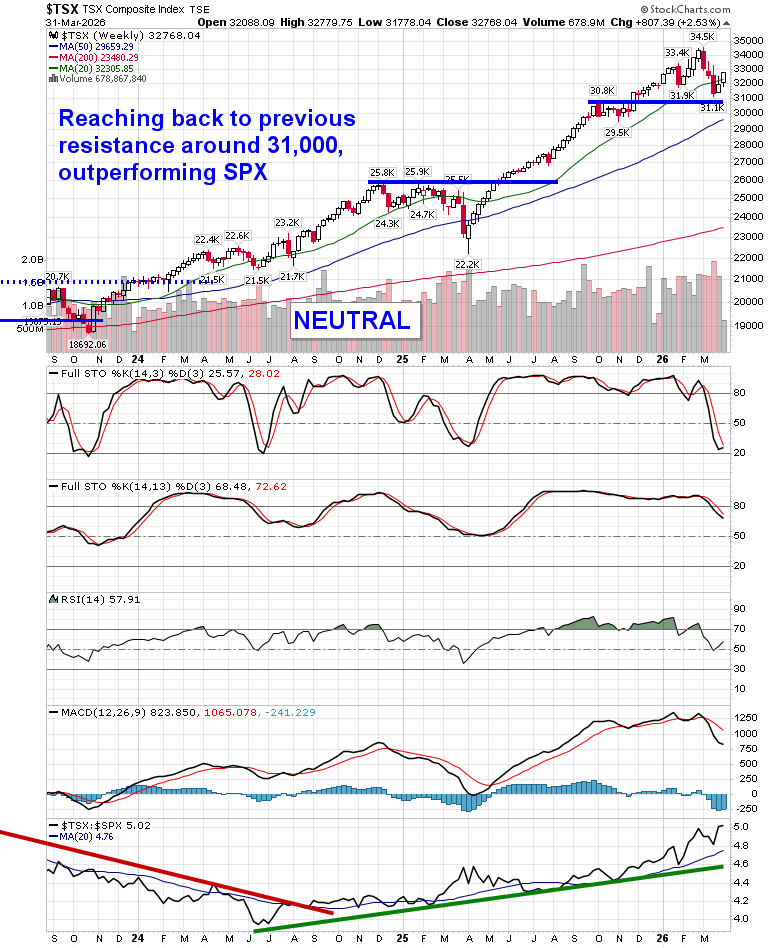
- Canada: Growth Weakening
- Stocks that have gained or lost in every April over their trading history
Subscribers can look for this report in their inbox or by clicking on the following link and logging in: Market Outlook for April 1
Not signed up yet? Subscribe now to receive full access to all of the research and analysis that we publish
Looking ahead, over the past five decades, the S&P 500 Index has averaged a return of 1.6% in the fourth month of the year with a gain frequency of 68%. This is the second best average performance of the year and it reiterates a desire to maintain some type of positive bias in risk assets during this spring month. Returns have ranged from a loss of 8.8% in April of 2022 to a gain of 12.7% in April of 2020. The average pattern for the month, based on this five decade timeframe, shows a rather steady rise in prices throughout the period with indications of increased strength around the middle of the month. We break down everything that we are looking at and how to position for the month ahead in our just released Monthly Outlook for April. Subscribe now
Just Released…
Our monthly report for April is out, providing you with everything that you need to know to navigate the market through the month(s) ahead.
Highlights in this report include:
- Equity market tendencies in the month of April
- Moving past the End of Quarter Mean Reversion
- Value over Growth Market
- Technology
- Looking towards the Industrial sector
- Manufacturers still Upbeat
- Electrification Theme within the Industrial Economy
- Time to overweight bonds?
- Threats to Loan Activity Following the Spike in Interest Rates
- Quality Stocks
- Gold Trade Tarnished
- Playing Natural Gas through the Shoulder Season for Demand
- Spring is the time for real estate
- April’s currency tailwind
- First Oversold Readings since the Liberation Day Selloff
- Our list of all segments of the market to either Accumulate or Avoid, along with relevant ETFs
- Positioning for the months ahead
- Sector Reviews and Ratings
- Stocks that have Frequently Gained in the Month of April
- Notable Stocks and ETFs Entering their Period of Strength in April
Subscribers can look for this 112-page report in their inbox and in the report archive.
Not signed up yet? Subscribe now to receive full access to all of the research and analysis that we publish
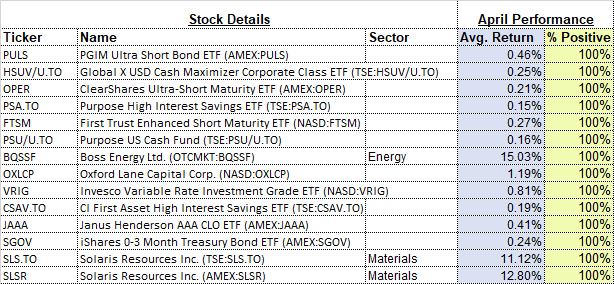
With the new month upon us and as we celebrate the release of our monthly report for April, today we release our screen of all of the stocks that have gained in every April over their trading history. While we at Equity Clock focus on a three-pronged approach (seasonal, technical, and fundamental analysis) to gain exposure to areas of the market that typically perform well over intermediate (2 to 6 months) timeframes, we know that stocks that have a 100% frequency of success for a particular month is generally of interest to those pursuing a seasonal investment strategy. Below are the results:
And how about those securities that have never gained in this fourth month of the year, here they are:
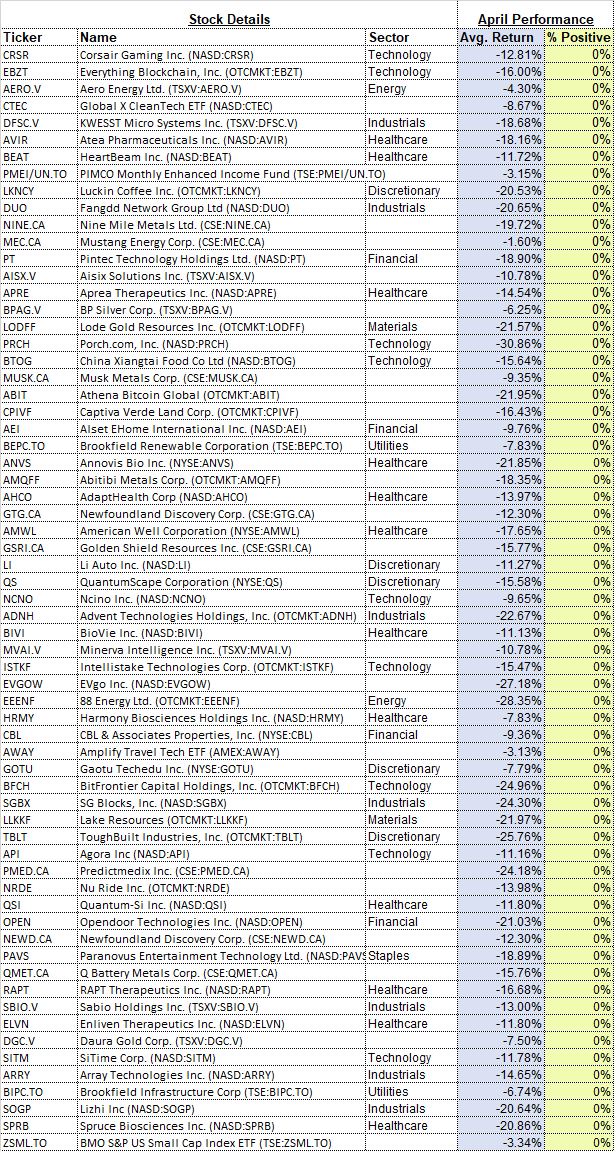
*Note: None of the results highlighted above have the 20 years of data that we like to see in order to accurately gauge the annual recurring, seasonal influences impacting an investment, therefore the reliability of the results should be questioned. We present the above list as an example of how our downloadable spreadsheet available to yearly subscribers can be filtered. For a more extensive list of high frequency (70% ) gainers for the month of April, please refer to our monthly report.
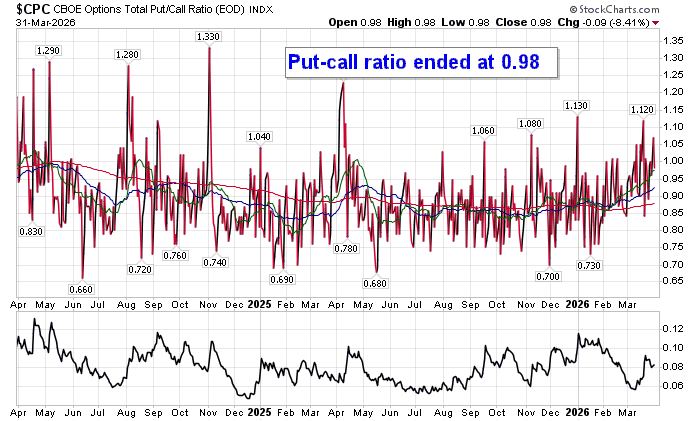
Sentiment on Tuesday, as gauged by the put-call ratio, ended close to Neutral at 0.98.
Seasonal charts of companies reporting earnings today:


S&P 500 Index
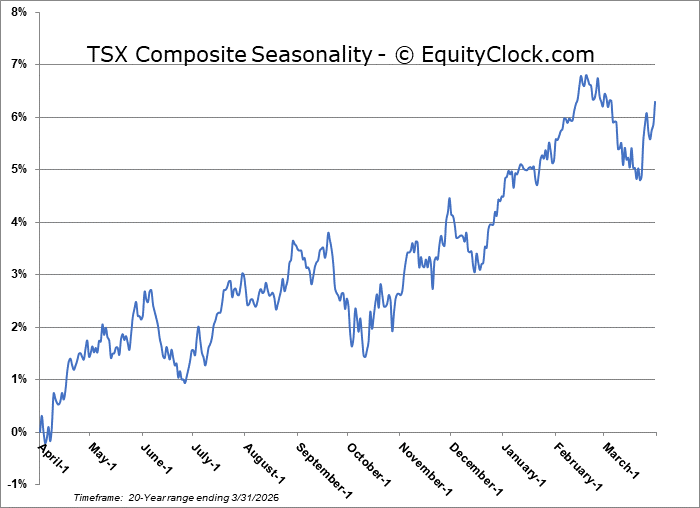
TSE Composite
| Sponsored By... |

|


