Stock Market Outlook for April 2, 2026

Market at a critical inflation point that could confirm or deny the strength that is average for stocks in the month of April.
*** Stocks highlighted are for information purposes only and should not be considered as advice to purchase or to sell mentioned securities. As always, the use of technical and fundamental analysis is encouraged in order to fine tune entry and exit points to average seasonal trends.
Stocks Entering Period of Seasonal Strength Today:
Subscribers Click on the relevant link to view the full profile. Not a subscriber? Signup here.
Stock Highlight: |
|

ALPS Medical Breakthroughs ETF (AMEX:SBIO) Seasonal Chart |
|

Liquidity Services Inc. (NASD:LQDT) Seasonal Chart

Cryo-Cell International Inc. (AMEX:CCEL) Seasonal Chart
Disclaimer: Comments and opinions offered in this report are for information only. They should not be considered as advice to purchase or to sell mentioned securities. Data offered is believed to be accurate, but is not guaranteed.
The Markets
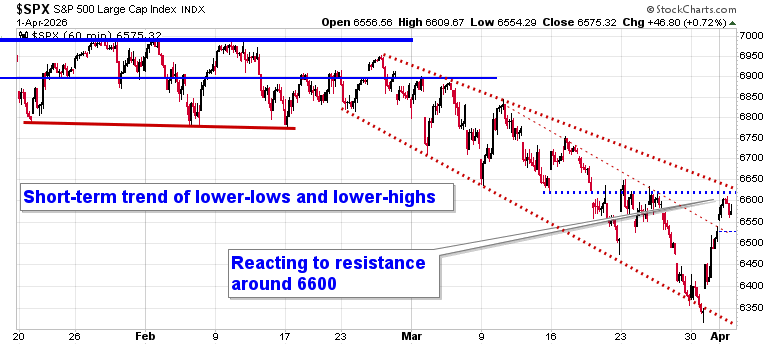
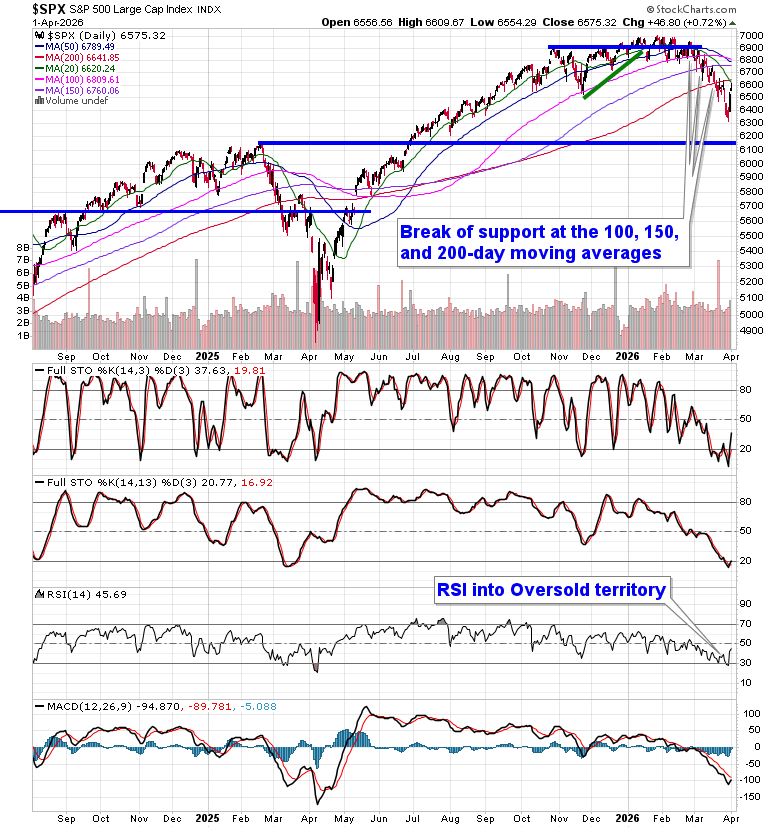
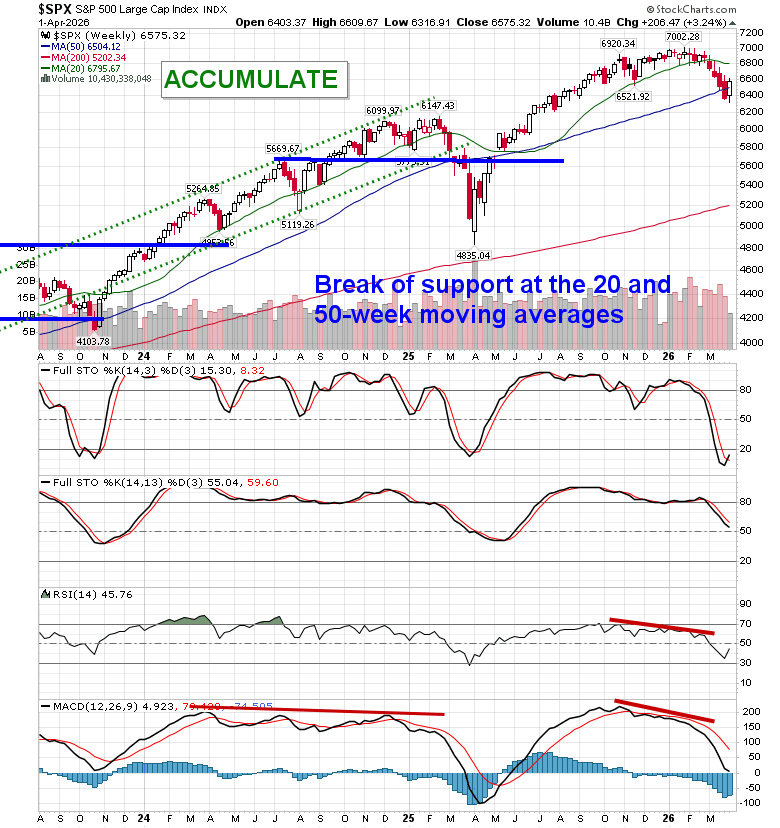
Stocks started off the month of April on a positive note as traders wait for comments from the US president in a night-time address to the nation on Wednesday. The S&P 500 Index added just over seven-tenths of one percent, continuing to move higher from levels around the lower limit of the declining trend channel that has been playing out over the past month. An alleviation of the parabolic decline from recent days is being offered. The benchmark is now back to the upper limit of its declining span, as well as horizontal resistance from the past couple of weeks, around 6620, reaction to which is already being observed; the benchmark is at a make or break point to the rebound that has elevated stocks into the start of this seasonally strong month of April. A short-term trend of lower-highs and lower-lows remains intact and major daily moving averages continue to provide formidable hurdles for the benchmark to overcome in order to sustain the recovery through the weeks ahead. In the Seasonal Advantage Portfolio that we manage for clients at CastleMoore, we rotated away from our low volatility posture and added to risk exposure a week and a half ago for the seasonally strong window that runs through the next two to four weeks. The conflict in Iran remains a wildcard and we are running down our cues that would warrant a more defensive posture in risk assets, but the net of all developments following the action from the past week between technicals, fundamentals, and seasonals for the near-term continue to provide the edge to an upside bias. Subscribers can view the updated list of themes in our chart books to either Accumulate or Avoid that we continue to gear portfolios towards.
Today, in our Market Outlook to subscribers, we discuss the following:
- Market Positioning: At a Critical Inflection Point
- Leadership Weakness: Tech & Consumer back to their breakdown points
- Consumer Cracks Are Widening
- Housing Price Weakness: A Recession Warning Signal
- Energy: Strong Trend, Short-Term Noise
- Seasonal Tailwind Still in Play
Subscribers can look for this report in their inbox or by clicking on the following link and logging in: Market Outlook for April 2
Not signed up yet? Subscribe now to receive full access to all of the research and analysis that we publish
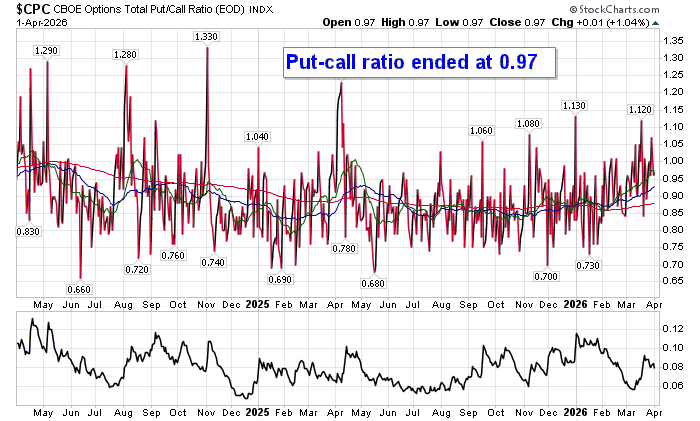
Sentiment on Wednesday, as gauged by the put-call ratio, ended close to Neutral at 0.97.
Seasonal charts of companies reporting earnings today:


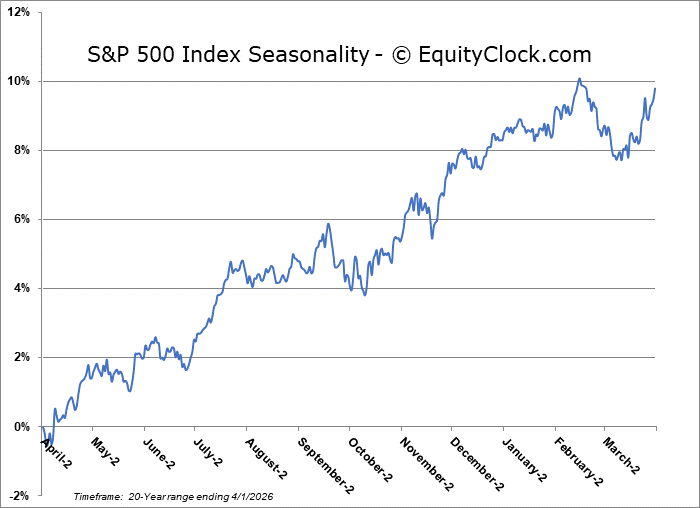
S&P 500 Index
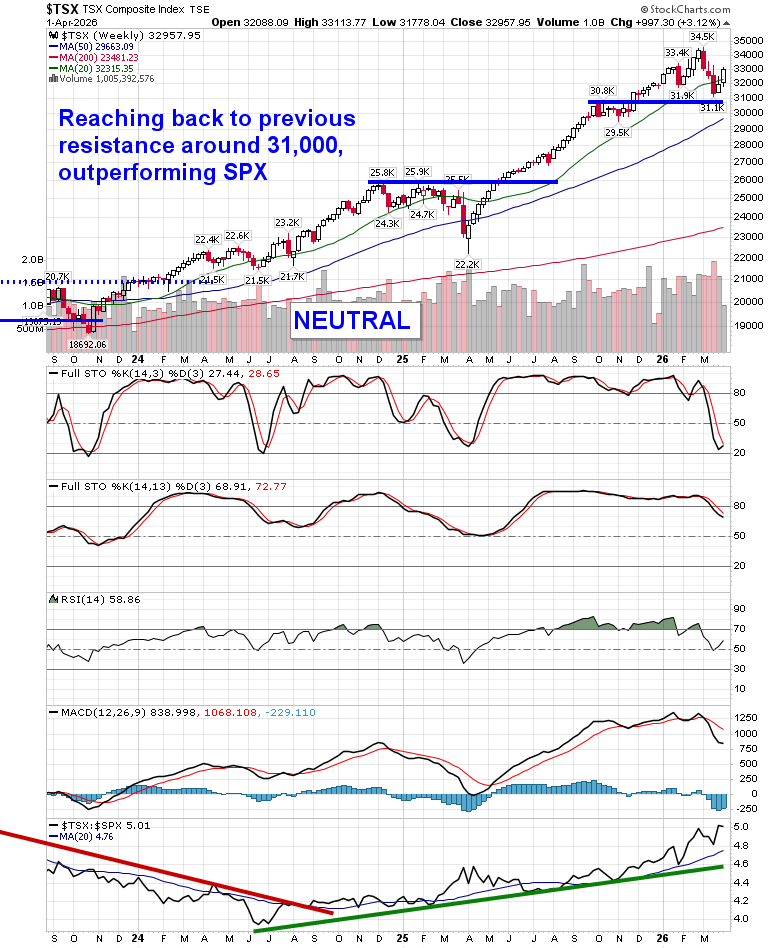
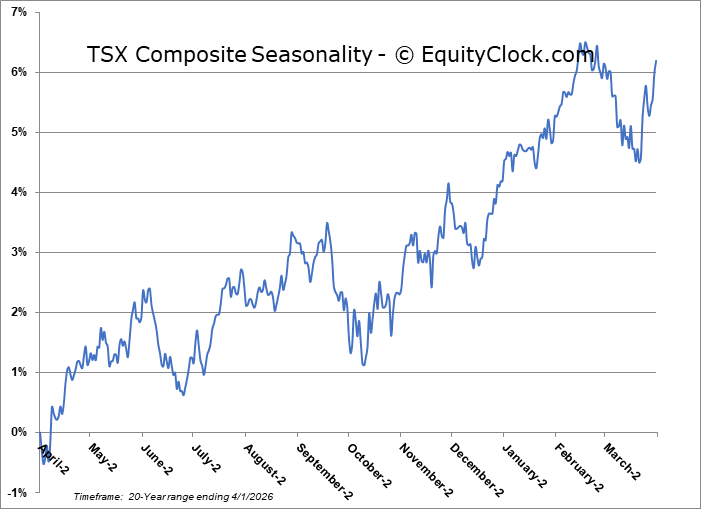
TSE Composite
| Sponsored By... |

|


