Stock Market Outlook for April 10, 2026

Large-cap valuations are well off of the unsustainable levels recorded over the past few years, but small caps may provide the better opportunity given that they are trading at a discount to their history and larger-cap counterparts.
*** Stocks highlighted are for information purposes only and should not be considered as advice to purchase or to sell mentioned securities. As always, the use of technical and fundamental analysis is encouraged in order to fine tune entry and exit points to average seasonal trends.
Stocks Entering Period of Seasonal Strength Today:
Subscribers Click on the relevant link to view the full profile. Not a subscriber? Signup here.
Stock Highlight: |
|
|
Invesco S&P SmallCap 600 Pure Growth ETF (NYSE:RZG) Seasonal Chart |
|


OSI Systems, Inc. (NASD:OSIS) Seasonal Chart

B. Riley Financial, Inc. (NASD:RILY) Seasonal Chart
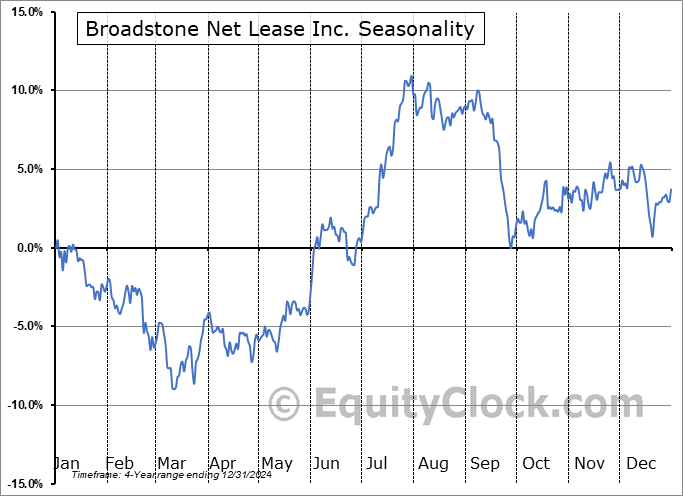
Broadstone Net Lease Inc. (NYSE:BNL) Seasonal Chart
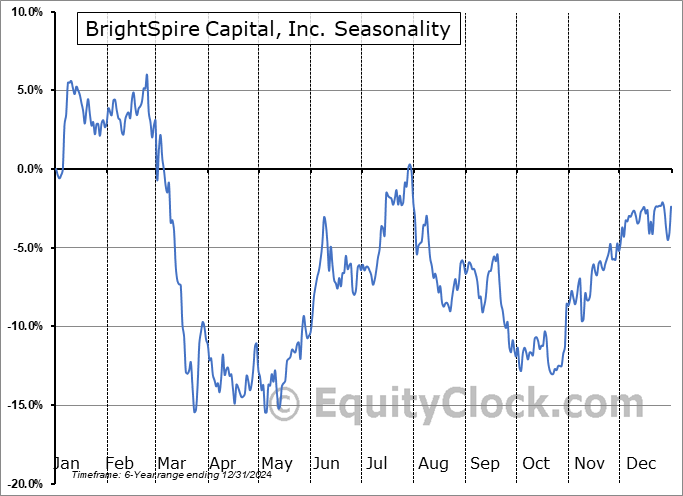
BrightSpire Capital, Inc. (NYSE:BRSP) Seasonal Chart

Commercial Vehicle Group Inc. (NASD:CVGI) Seasonal Chart
Disclaimer: Comments and opinions offered in this report are for information only. They should not be considered as advice to purchase or to sell mentioned securities. Data offered is believed to be accurate, but is not guaranteed.
The Markets
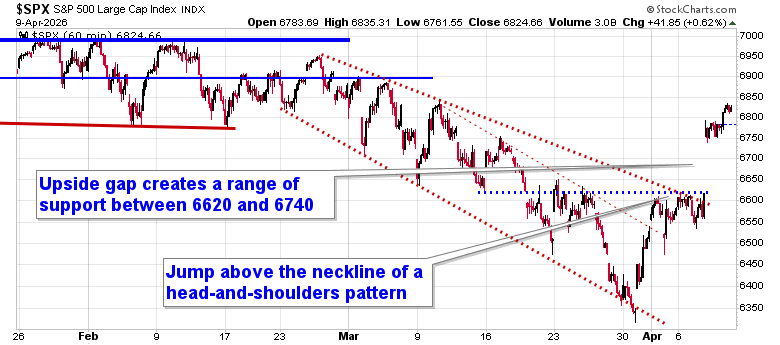
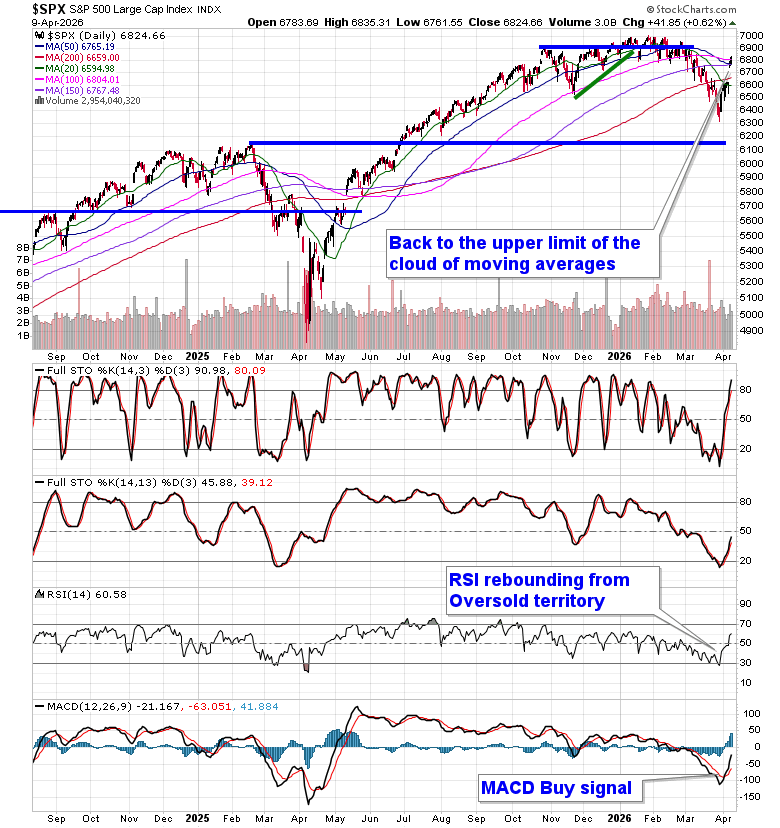
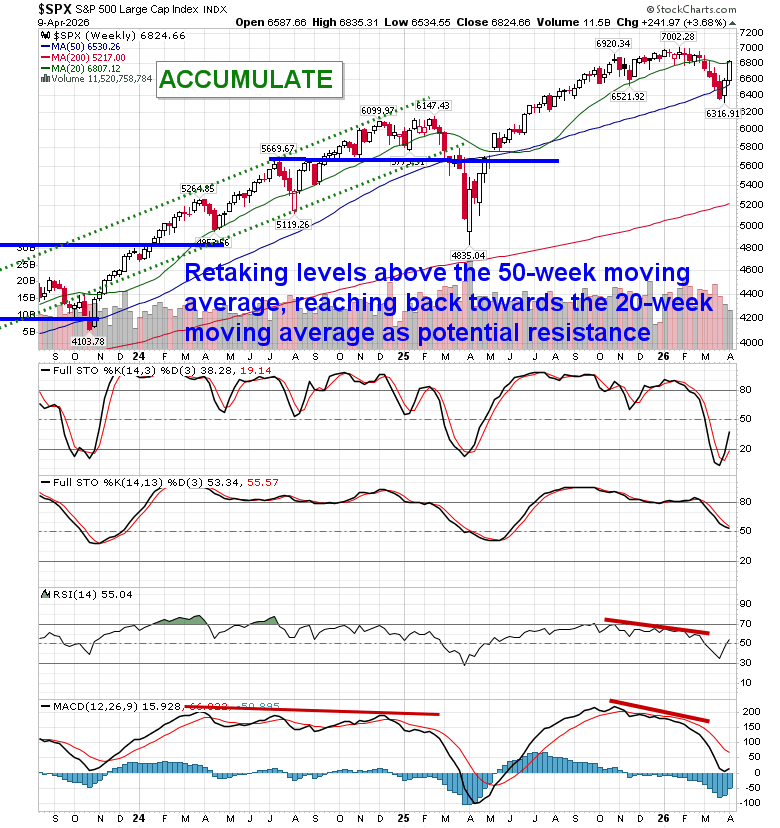
Stocks followed through from their Wednesday gains as traders continue to monitor developments pertaining to the ceasefire with Iran. The S&P 500 Index added just over six-tenths of one percent, continuing to move higher off of the head-and-shoulders bottoming pattern that saw its neckline around 6620. The jump above the range between 6620 and 6740 creates a zone of support below the market, flipping the script from the past month and a half of resistance holding greater weight than support. The bullish setup proposes an upside resolution to 6900, or back to the important pivot point in the market that we had highlighted in January and February. The 200-day moving average, which had been heavily scrutinized by many in recent weeks, has been retaken and the upper limit of the cloud of moving averages at 6800 is being tested. The negativity that investors had adopted around the 200-day moving average was suggesting that traders had become offside in their market positioning, ill-prepared for the type of move that was realized on Wednesday. We adopted the contrarian view, looking for the move above the threshold that has shaken the negative sentiment of many and is drawing traders back in before what could be another round of weakness in equity markets later this spring (aligned with how stocks perform in mid-term election years under a new presidential party). So far, this has proven to be the correct stance. In the Seasonal Advantage Portfolio (which is strongly higher YTD and back to its high watermark that was charted in February) that we manage for clients at CastleMoore, we continue to be fully exposed to risk (stocks) after flipping from our low volatility stance around the end of March and our performance is benefitting. The conflict in Iran remains a wildcard and we are running down our cues that would warrant a more defensive posture in risk assets, but the net of all developments following the action from the past couple of weeks between technicals, fundamentals, and seasonals have provided the edge to an upside bias (and it has been working). Subscribers can view the updated list of themes in our chart books to either Accumulate or Avoid that we continue to gear portfolios towards.
Today, in our Market Outlook to subscribers, we discuss the following:
- Breakout Follow-Through: Uptrend Gaining Credibility
- Geopolitics: Still a Wildcard
- Valuation Backdrop: Supportive
- Interest Rates: In the “Goldilocks Zone”
- Macro Signals: Coincident Signals Stable, Not Recessionary
- Small Caps: Strong Risk-On Signal
- Large-cap Technology (Software): Still a Weak Link
Subscribers can look for this report in their inbox or by clicking on the following link and logging in: Market Outlook for April 10
Not signed up yet? Subscribe now to receive full access to all of the research and analysis that we publish
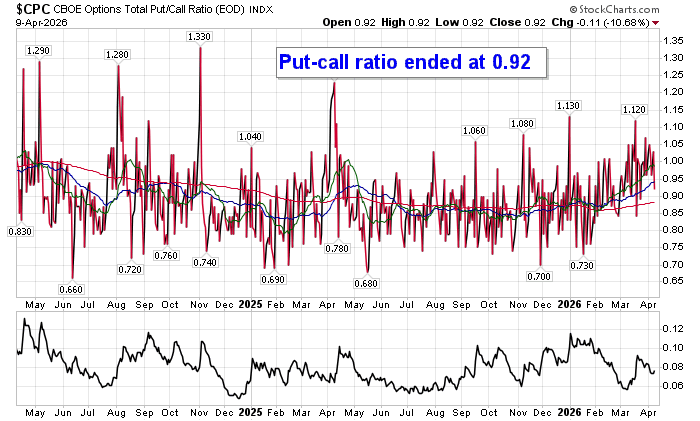
Sentiment on Thursday, as gauged by the put-call ratio, ended slightly bullish at 0.92.
Seasonal charts of companies reporting earnings today:
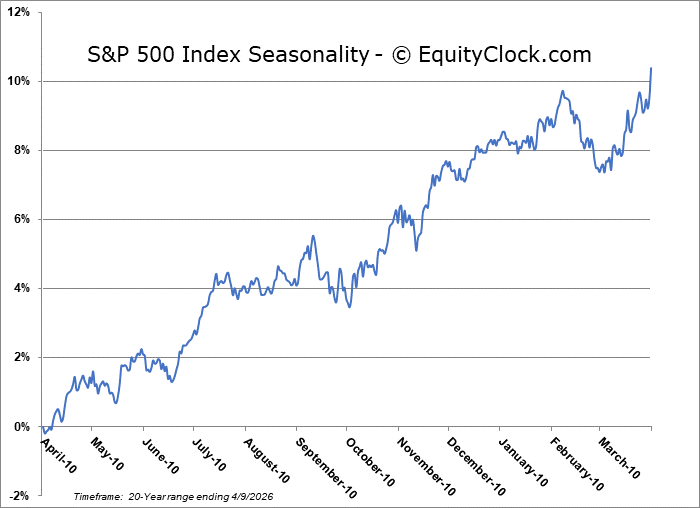
S&P 500 Index
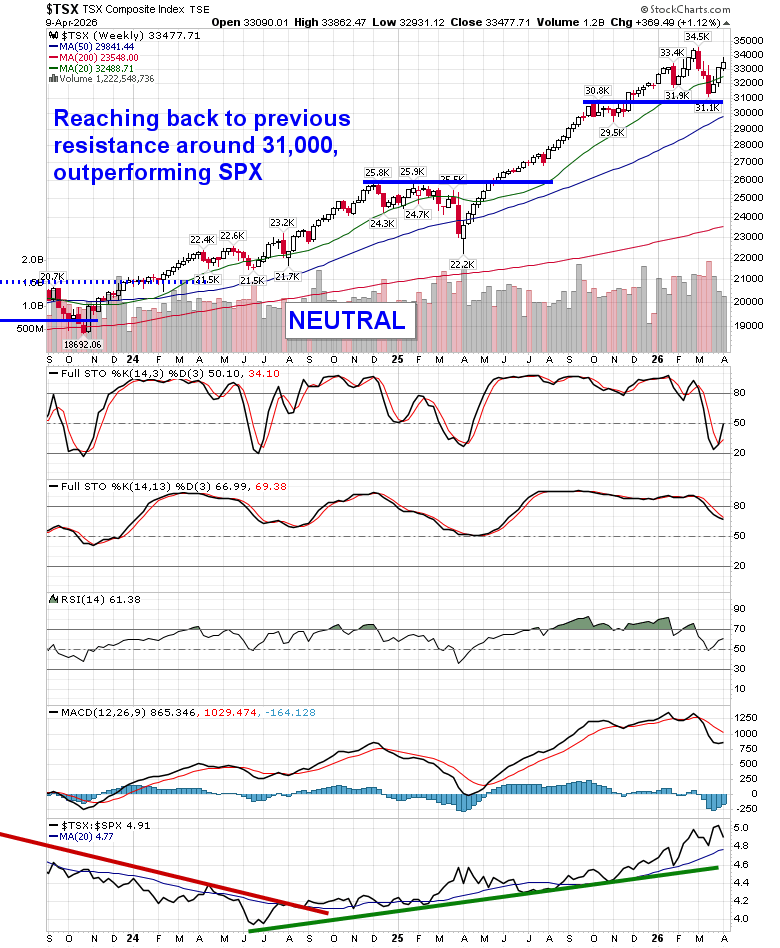
TSE Composite
| Sponsored By... |

|


