Stock Market Outlook for May 8, 2026

Emerging leadership presenting new opportunities heading into the off-season for risk assets.
*** Stocks highlighted are for information purposes only and should not be considered as advice to purchase or to sell mentioned securities. As always, the use of technical and fundamental analysis is encouraged in order to fine tune entry and exit points to average seasonal trends.
Stocks Entering Period of Seasonal Strength Today:
Subscribers Click on the relevant link to view the full profile. Not a subscriber? Signup here.
Stock Highlight: |
|

TOMI Environmental Solutions, Inc. (NASD:TOMZ) Seasonal Chart |
|

Sensus Healthcare, Inc. (NASD:SRTS) Seasonal Chart

iShares S&P 500 Growth ETF (NYSE:IVW) Seasonal Chart

Match Group, Inc (NASD:MTCH) Seasonal Chart
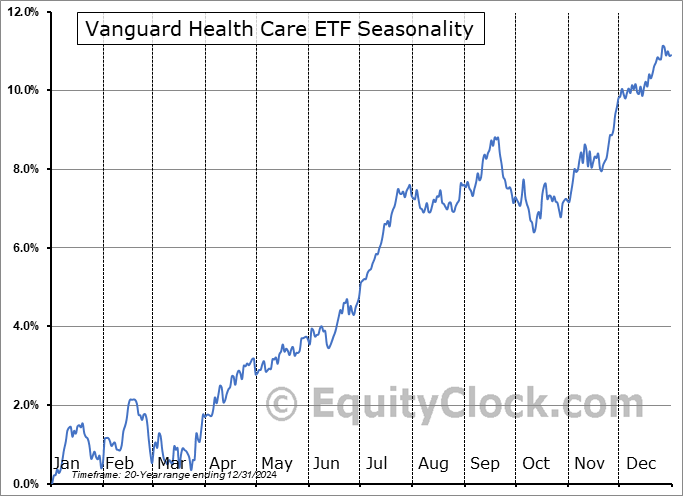
Vanguard Health Care ETF (NYSE:VHT) Seasonal Chart

Vanguard Long-Term Government Bond ETF (NASD:VGLT) Seasonal Chart

iShares 20+ Year Treasury Bond ETF (NASD:TLT) Seasonal Chart

iShares Global Healthcare ETF (NYSE:IXJ) Seasonal Chart

Telephone & Data Systems Inc. (NYSE:TDS) Seasonal Chart

Renaissance IPO ETF (AMEX:IPO) Seasonal Chart

iShares U.S. Pharmaceuticals ETF (NYSE:IHE) Seasonal Chart

Santacruz Silver Mining Ltd. (TSXV:SCZ.V) Seasonal Chart

Adobe Systems, Inc. (NASD:ADBE) Seasonal Chart

Baidu, Inc. (NASD:BIDU) Seasonal Chart

Seabridge Gold Inc. (TSE:SEA.TO) Seasonal Chart

CareDx Inc. (NASD:CDNA) Seasonal Chart

Guardant Health Inc. (NASD:GH) Seasonal Chart

SPDR S&P 500 Growth ETF (NYSE:SPYG) Seasonal Chart

Zscaler, Inc. (NASD:ZS) Seasonal Chart
Disclaimer: Comments and opinions offered in this report are for information only. They should not be considered as advice to purchase or to sell mentioned securities. Data offered is believed to be accurate, but is not guaranteed.
The Markets
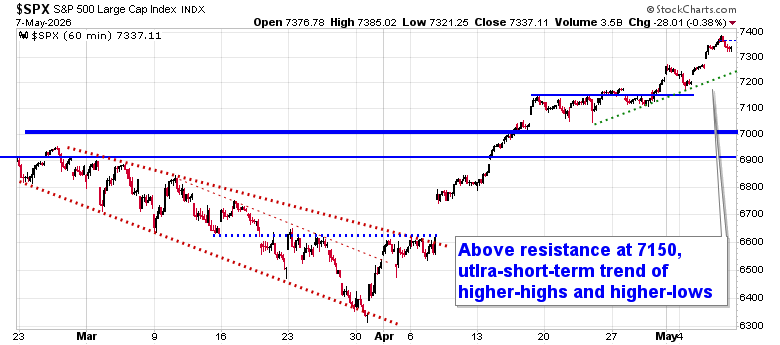
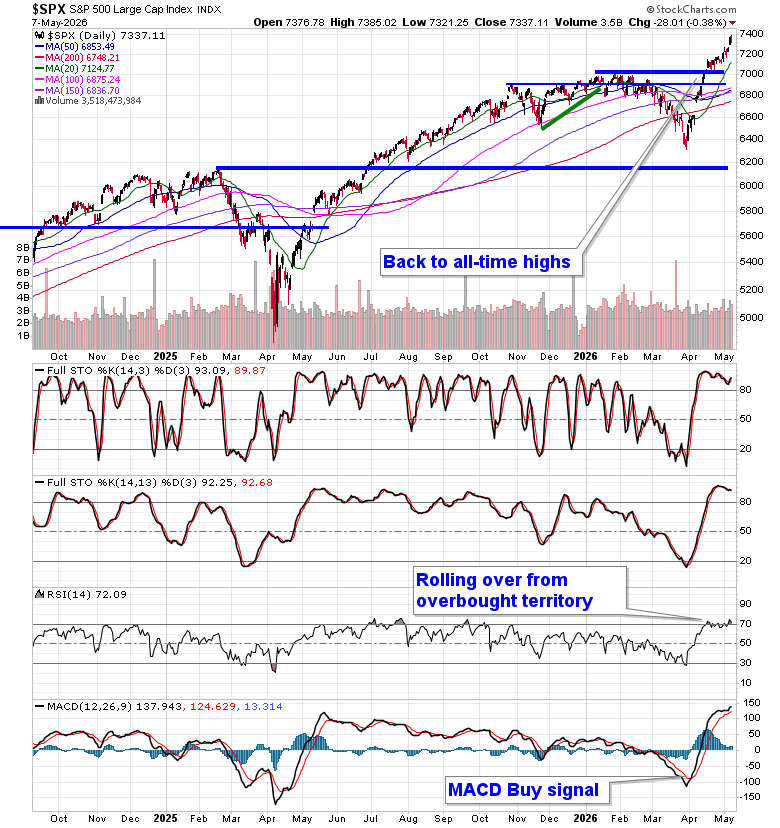
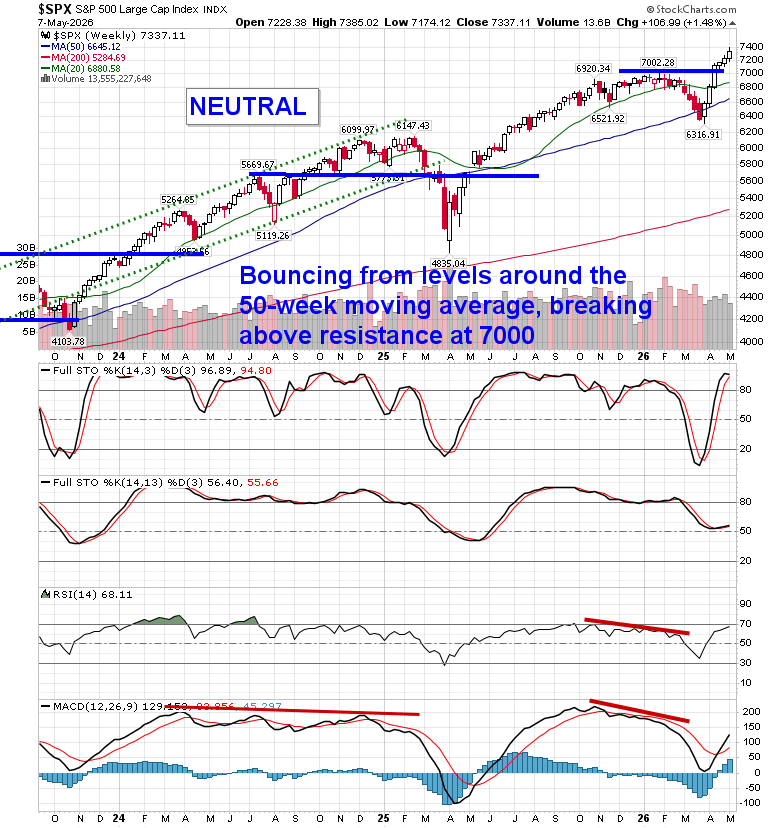
Stocks pulled back slightly on Thursday as investors continue to monitor developments pertaining to the Iran deal and the resulting impact on oil prices. The S&P 500 Index retraced by nearly four-tenths of one percent, remaining above the upside gap between 7270 and 7300 that was charted on Wednesday. The gaps beneath the market, looked to as levels of support, continue to accumulate, including the big one between 6620 and 6740, and, ultimately, the character of the market has changed where levels of resistance hold less weight than levels of support. As the market continues to move higher, so too do downside risks in the near-term, which can now be pegged towards levels around 7000 (the January highs). We are still playing with a positive side bias (albeit with hedges that have been added in recent weeks– see our April 22 Market Outlook). Momentum indicators continue to show signs of stall around overbought territory and there remains indication of upside exhaustion that could lend to a digestive phase on the horizon, particularly once we move beyond the height to earnings season. In the Seasonal Advantage Portfolio (which is strongly higher YTD, continuing to set new high watermarks) that we manage for clients at CastleMoore, we continue to be fully exposed to risk (stocks) after flipping from our low volatility stance around the end of March and our performance has been excellent (strongly outperforming the S&P 500 Index, Nasdaq Composite, and TSX Composite). The conflict in Iran remains a wildcard (and we are skeptical of the suggestion of a return to normal that the market is seemingly pricing in), but we have cues that we are following that would warrant abandoning our risk-on view and move towards a more defensive posture in risk assets. Subscribers can view the themes in our chart books to either Accumulate or Avoid that we continue to gear portfolios towards.
Today, in our Market Outlook to subscribers, we discuss the following:
- The breakout in Software and how we’re playing it
- The shift of character of a major tech/AI titan heading into its strongest time of year
- Industrial Sector
- Health Care Sector
- Bullish engulfing candlestick in yields
- US Construction Spending and how to play the fundamental backdrop
- Weekly Jobless Claims and a preview of what to expect from the monthly non-farm payroll report
Subscribers can look for this report in their inbox or by clicking on the following link and logging in: Market Outlook for May 8
Not signed up yet? Subscribe now to receive full access to all of the research and analysis that we publish
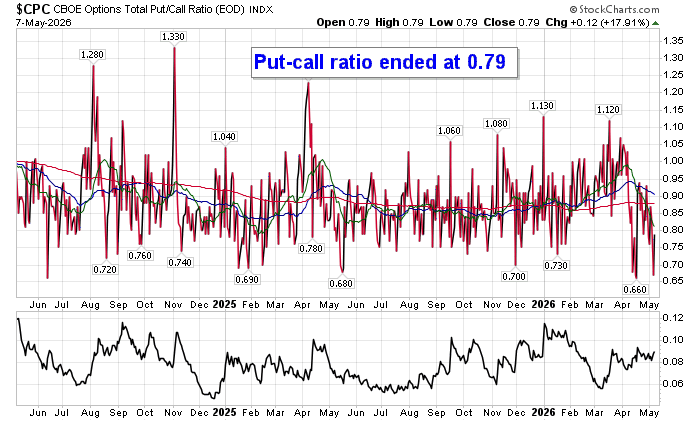
Sentiment on Thursday, as gauged by the put-call ratio, ended bullish at 0.79.
Seasonal charts of companies reporting earnings today:


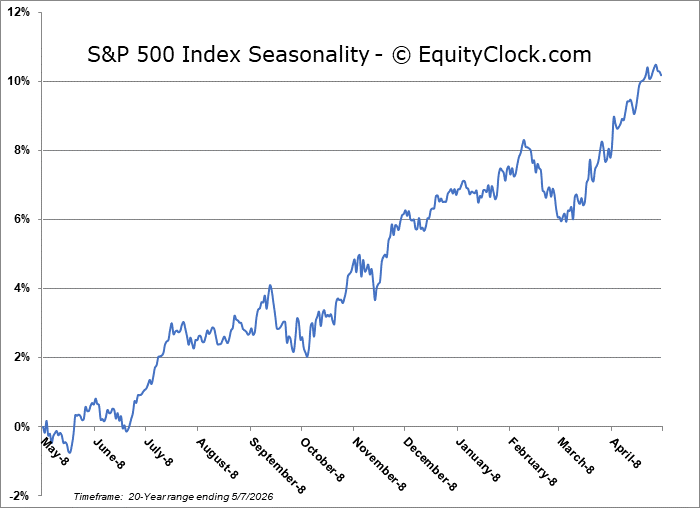
S&P 500 Index
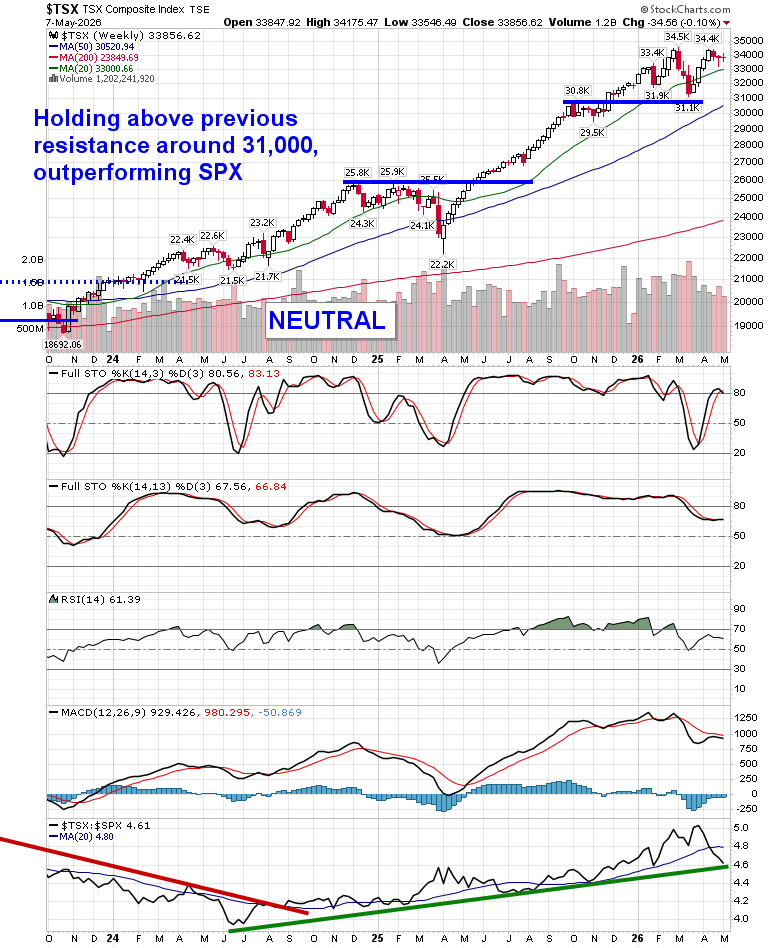
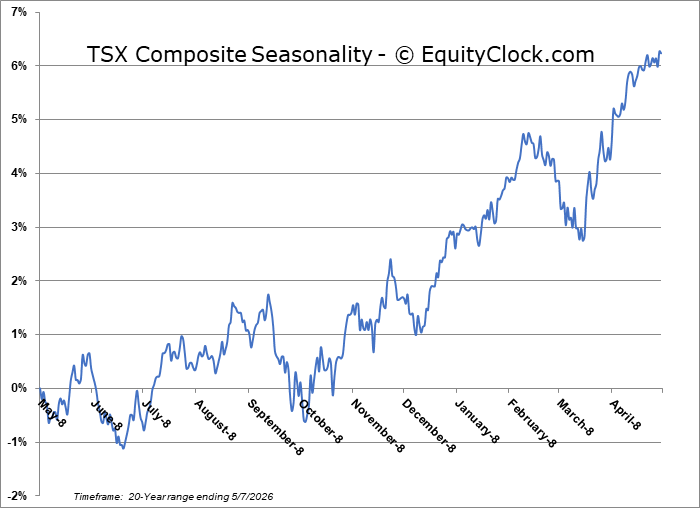
TSE Composite
| Sponsored By... |

|


