Stock Market Outlook for October 19, 2026

Defense industry providing a way to defend portfolios as market instability grows.
*** Stocks highlighted are for information purposes only and should not be considered as advice to purchase or to sell mentioned securities. As always, the use of technical and fundamental analysis is encouraged in order to fine tune entry and exit points to average seasonal trends.
Stocks Entering Period of Seasonal Strength Today:
Subscribers Click on the relevant link to view the full profile. Not a subscriber? Signup here.

NXP Semiconductor N.V. (NASD:NXPI) Seasonal Chart

Werner Enterprises, Inc. (NASD:WERN) Seasonal Chart

Booking Holdings Inc. (NASD:BKNG) Seasonal Chart

ASML Holding NV (NASD:ASML) Seasonal Chart

Marriott International, Inc. (NASD:MAR) Seasonal Chart

MercadoLibre Inc. (NASD:MELI) Seasonal Chart
Disclaimer: Comments and opinions offered in this report are for information only. They should not be considered as advice to purchase or to sell mentioned securities. Data offered is believed to be accurate, but is not guaranteed.
The Markets
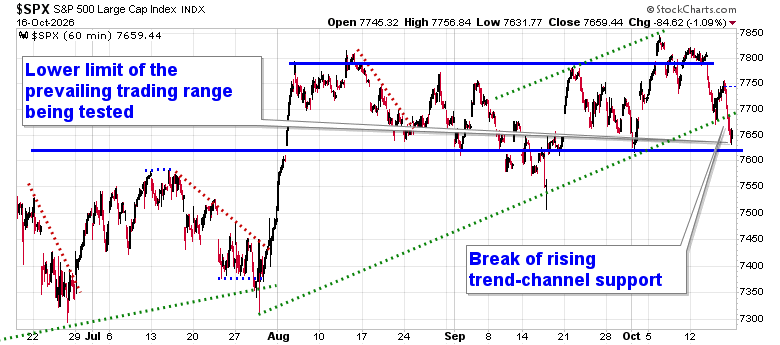
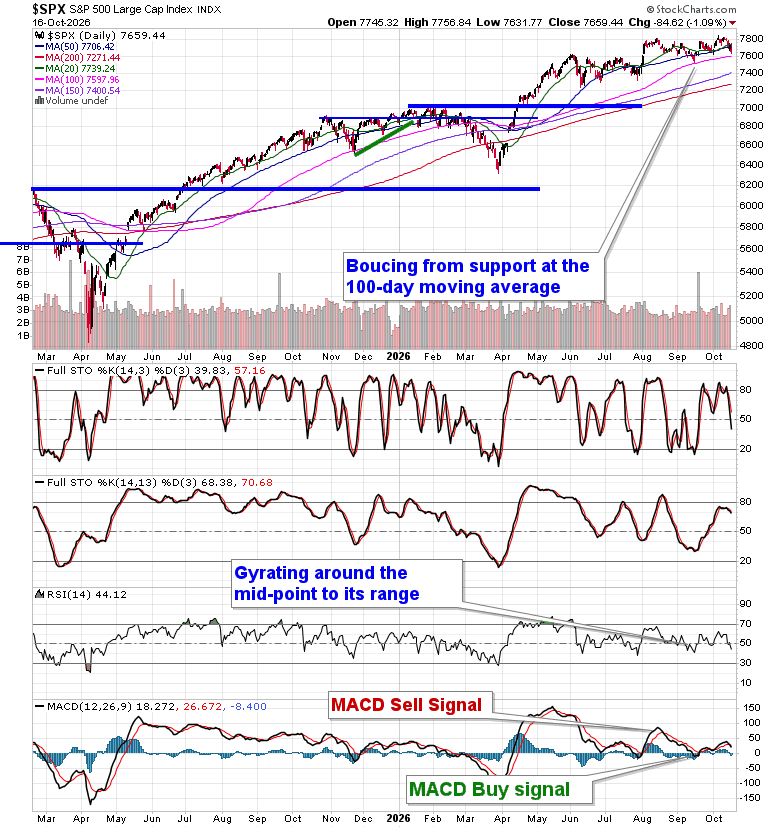
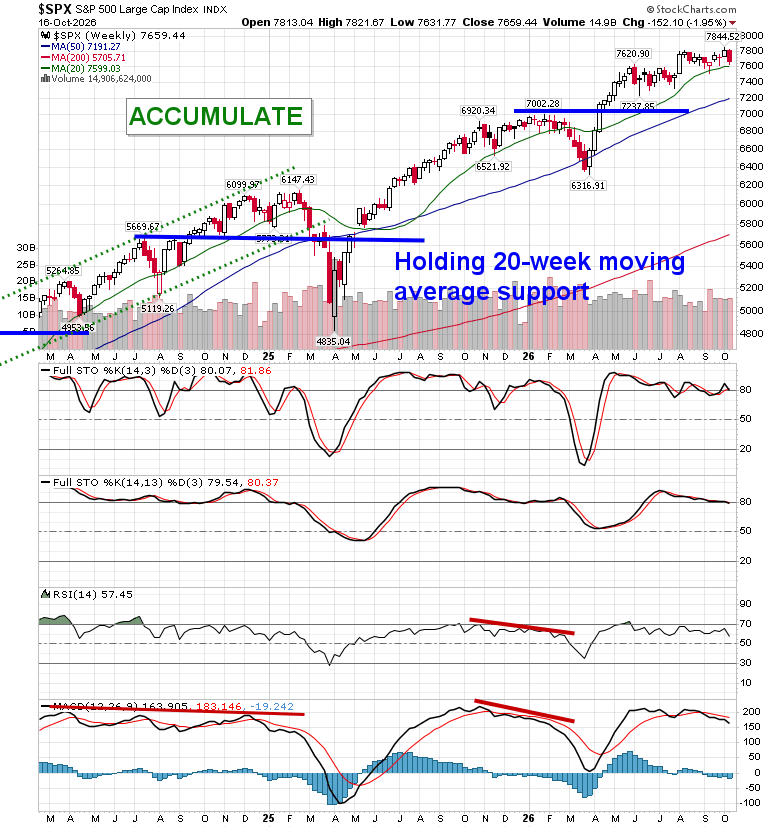
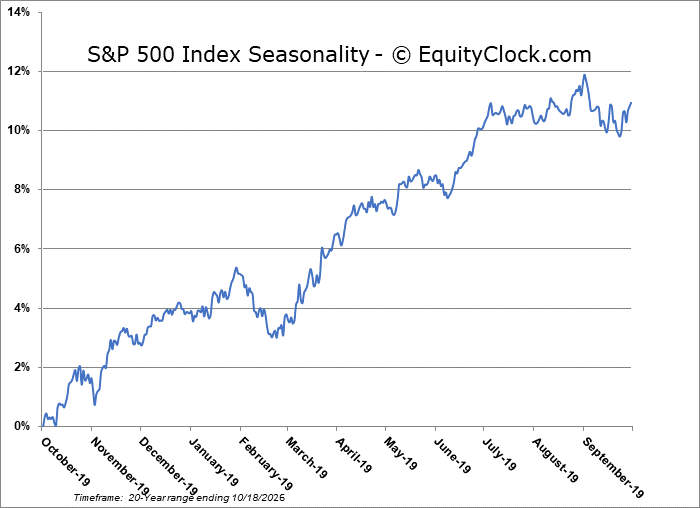
The ongoing rotation away from technology pressured stocks lower on Friday. The S&P 500 Index ended down by just over one percent, breaking below short-term rising trend channel support that had promoted the recent path of higher-highs and higher-lows in the past month. The breakdown suggests the end of the rising trajectory that was carrying the benchmark toward a target of 8000. The benchmark is back within the range that it has been in since August between 7620 and 7800, the lower limit of which came close to being tested on the day. Support at 20 and 50-day moving averages has been taken out and the 100-day moving average is once again up to bat. Weakening support certainly raises concerns for the health of stocks moving forward. The market has reached the time of year when volatility starts to peak and roll over through the last couple of months of the year, thereby promoting strength in stocks, but the breakout in the VIX on Friday above declining trendline resistance provides the inkling that the instability that is leaching into the market may just be getting started. We’ll be taking a look at things more closely over the weekend to determine what may be the appropriate market stance heading into what is traditionally a more favourable backdrop for stocks, from a seasonal perspective, through the last two and a half months of the year.Details of our findings will be released to subscribers in our next chart books update. The rolling correction among the sectors since August may be enough to suggest that we are closer to the end of this period of weakness in the market (not that it amounted to much, if anything, on the aggregate benchmark) that action my not be appropriate, but we can already see various segments of the market that we no longer want to be exposed to and those that are showing good prospects for the months ahead. More on that below in our subscriber report. Members can stay on top of our thinking and what we are watching in our regular reports, as well as view what we are targeting in our list of market segments to either Accumulate or Avoid.
Today, in our Market Outlook to subscribers, we discuss the following:
- Weekly look at the large-cap benchmark
- US Industrial Production and the investment implications within
- The breakdown of Semiconductors
- Upbeat manufacturer sentiment
- The trend of shipping volumes and expenditures
- Software stocks
- Additional Thoughts
Subscribers can look for this report in their inbox or by clicking on the following link and logging in: Market Outlook for October 19
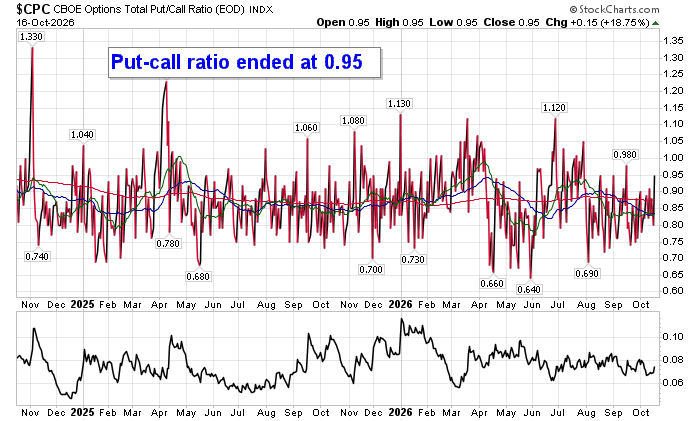
Sentiment on Friday, as gauged by the put-call ratio, ended close to neutral at 0.95.
Seasonal charts of companies reporting earnings today:






S&P 500 Index
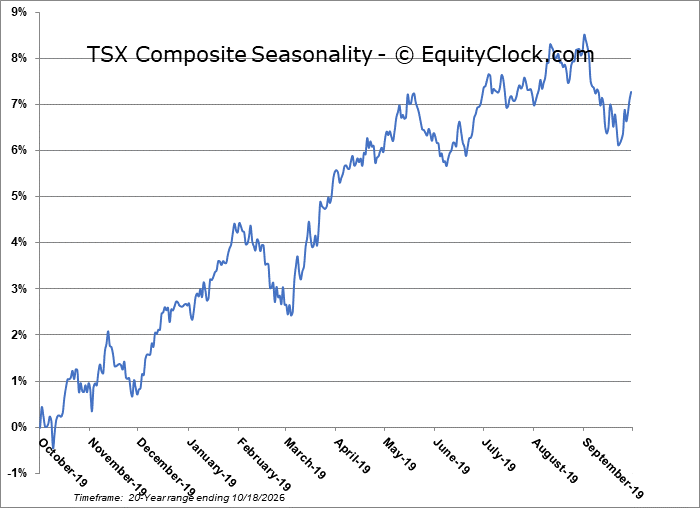
TSE Composite
| Sponsored By... |

|


