Stock Market Outlook for October 18, 2021

Despite a strong report on retail sales for September, retail stocks closed lower on the day. Find out when we foresee the opportunity to trade this industry will be presented in today’s report.
Â
Â
*** Stocks highlighted are for information purposes only and should not be considered as advice to purchase or to sell mentioned securities.  As always, the use of technical and fundamental analysis is encouraged in order to fine tune entry and exit points to average seasonal trends.
Stocks Entering Period of Seasonal Strength Today:
Subscribers – Click on the relevant link to view the full profile. Not a subscriber? Signup here.

Textron, Inc. (NYSE:TXT) Seasonal Chart

Stanley Black & Decker Inc. (NYSE:SWK) Seasonal Chart

Steel Dynamics, Inc. (NASD:STLD) Seasonal Chart

Capstone Mining Corp. (TSE:CS.TO) Seasonal Chart

Comfort Systems U S A, Inc. (NYSE:FIX) Seasonal Chart

Stantec Inc (NYSE:STN) Seasonal Chart

ViacomCBS Inc (NASD:VIACA) Seasonal Chart

BMO Dow Jones Industrial Average Hedged to CAD Index ETF (TSE:ZDJ.TO) Seasonal Chart

BMO S&P 500 Index ETF (TSE:ZSP.TO) Seasonal Chart

Akamai Technologies, Inc. (NASD:AKAM) Seasonal Chart

Home Depot, Inc. (NYSE:HD) Seasonal Chart

Honeywell Intl (NYSE:HON) Seasonal Chart
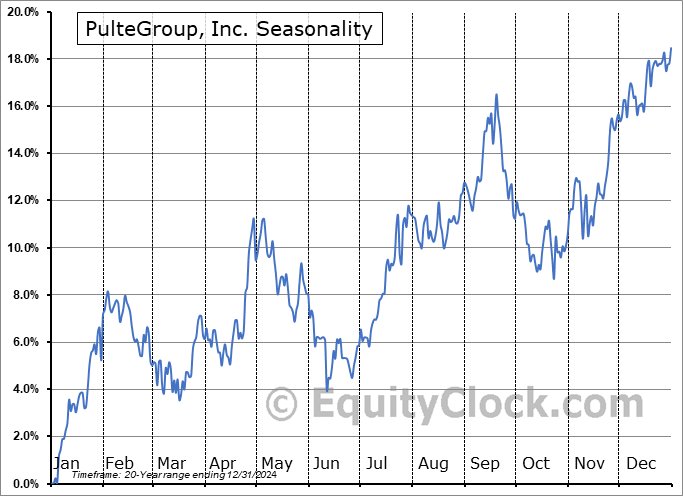
PulteGroup, Inc. (NYSE:PHM) Seasonal Chart

Interpublic Grp Of Cos (NYSE:IPG) Seasonal Chart

PNC Financial Services Gr (NYSE:PNC) Seasonal Chart

Teradyne, Inc. (NASD:TER) Seasonal Chart

DR Horton Inc. (NYSE:DHI) Seasonal Chart

Champion Iron Ltd. (TSE:CIA.TO) Seasonal Chart

Science Applications International Corp. (NYSE:SAIC) Seasonal Chart

Vanguard U.S. Total Market Index ETF (TSE:VUN.TO) Seasonal Chart

iShares Core S&P U.S. Total Market Index ETF (TSE:XUU.TO) Seasonal Chart

iShares U.S. Industrials ETF (NYSE:IYJ) Seasonal Chart

iShares PHLX Semiconductor ETF (NASD:SOXX) Seasonal Chart
Â
Â
The Markets
Stocks pushed higher on Friday following the ongoing release of stronger than anticipated earnings. The S&P 500 Index gained three-quarters of one percent, moving above intermediate resistance at its 50-day moving average and surpassing the short-term peak charted in the back half of September. Momentum indicators are quickly relinquishing their bearish characteristics now that the short-term path of lower-lows and lower-highs has been violated. The short-term bottoming pattern by way of a head-and-shoulders setup can be seen on the chart, which projects a move to new all-time highs. The strength continues to bode well for our core-cyclical bets that our model portfolio is allocated towards.

Today, in our Market Outlook to subscribers, we discuss the following:
- Weekly look at the large-cap benchmark and the typically rocky period for the benchmark in the middle of October
- The strength of core-cyclical bets in the market
- US Retail Sales and what is driving aggregate activity
- Lumber and forestry stocks
- The lackluster performance of retail stocks and when we see our shot to trade the industry
Subscribe now and we’ll send this outlook to you.
Sentiment on Friday, as gauged by the put-call ratio, ended bullish at 0.86.

Â
Seasonal charts of companies reporting earnings today:


Â
Â
S&P 500 Index


Â
TSE Composite


| Sponsored By... |

|

