Stock Market Outlook for February 7, 2022

Wages are soaring out of control, which is causing rates to spike.
*** Stocks highlighted are for information purposes only and should not be considered as advice to purchase or to sell mentioned securities. As always, the use of technical and fundamental analysis is encouraged in order to fine tune entry and exit points to average seasonal trends.
Stocks Entering Period of Seasonal Strength Today:
Subscribers – Click on the relevant link to view the full profile. Not a subscriber? Signup here.

Electronic Arts, Inc. (NASD:EA) Seasonal Chart

General Mills Inc. (NYSE:GIS) Seasonal Chart

Kemper Corp. (NYSE:KMPR) Seasonal Chart

Red Robin Gourmet Burgers Inc. (NASD:RRGB) Seasonal Chart
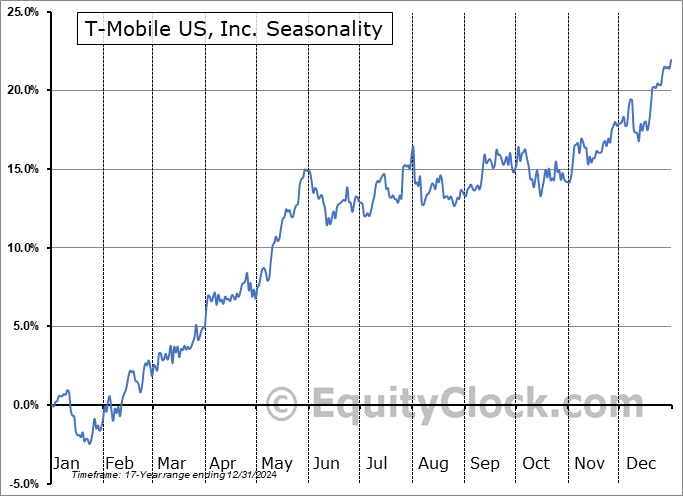
T-Mobile US, Inc. (NASD:TMUS) Seasonal Chart

Invesco Dynamic Food & Beverage ETF (NYSE:PBJ) Seasonal Chart

Vanguard Consumer Staples ETF (NYSE:VDC) Seasonal Chart

CI WisdomTree International Qlty Divi Growth Index ETF (TSE:IQD.TO) Seasonal Chart

Broadcom Inc. (NASD:AVGO) Seasonal Chart

Vicor Corp. (NASD:VICR) Seasonal Chart

SPDR EURO STOXX 50 ETF (NYSE:FEZ) Seasonal Chart

Invesco Global Water ETF (NASD:PIO) Seasonal Chart
The Markets
Stocks recovered from early day losses on Friday following a staggeringly strong payroll report for the month of January. The Bureau of Labor Statistics indicates that 467,000 payrolls were added last month, which far surpasses the consensus analyst estimate that called for a rise of 150,000. The unemployment rate ticked higher from 3.9% to 4.0% and average hourly earnings surged by 0.7%, which was stronger than the 0.5% increase that was forecasted. Stripping out the seasonal adjustments, payrolls actually plunged by 2.824 million, or 1.9%, in January, which is stronger than the 2.1% decline that is average for this first month of the year. This is the weakest start to the year since 2019. The result follows last year’s stellar pace, which saw payrolls increase by 4.7%, representing the strongest calendar-year payroll growth since 1978! We sent out further insight to subscribers intraday, including the investment implications of the trends within. Subscribe now.

The S&P 500 Index closed Friday’s session with a gain of just over half of one percent, clawing back a fraction of the prior day’s decline. The benchmark was seen bouncing between two extremes at the 200-day moving average at the low and at the 20-day moving average at the high as battle between long-term investors and short-term traders starts to play out. With opposing support and resistance dynamics, it is difficult to ascertain who was really in control, the bulls or the bears. For now, we’ll take the level of support at the 200-day given the recovery above this long-term hurdle early in the week, but understand that the market remains in this highly tenuous position. Momentum indicators are still trending lower and the characteristics of a bearish trend remain.

Today, in our Market Outlook to subscribers, we discuss the following:
- Weekly look at the large-cap benchmark
- US Payroll Report
- Soaring employee wages and the breakout of treasury yields
- Canadian Labour Force Survey
- Canadian equities and how long they tend to outperform those in the US
Subscribe now and we’ll send this outlook to you.
Sentiment on Friday, as gauged by the put-call ratio, ended close to neutral at 0.95.

Seasonal charts of companies reporting earnings today:


S&P 500 Index


TSE Composite


| Sponsored By... |

|

