Stock Market Outlook for October 17, 2022

As we near the period of seasonal strength for retail stocks heading into the holiday period, we are unable to check the fundamental prong to our approach to justify inclusion in seasonal portfolios.
*** Stocks highlighted are for information purposes only and should not be considered as advice to purchase or to sell mentioned securities. As always, the use of technical and fundamental analysis is encouraged in order to fine tune entry and exit points to average seasonal trends.
Stocks Entering Period of Seasonal Strength Today:
Subscribers – Click on the relevant link to view the full profile. Not a subscriber? Signup here.
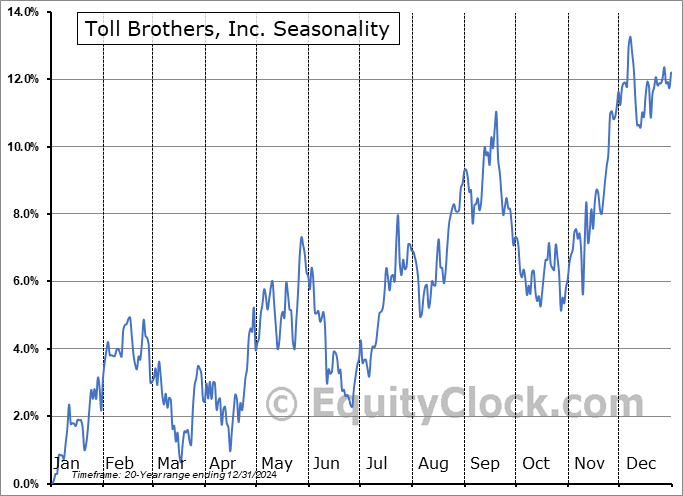
Toll Brothers, Inc. (NYSE:TOL) Seasonal Chart
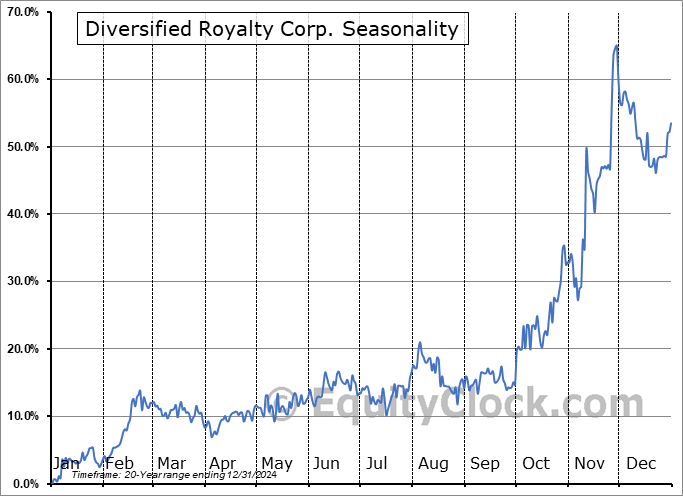
Diversified Royalty Corp. (TSE:DIV.TO) Seasonal Chart
WSP Global Inc. (TSE:WSP.TO) Seasonal Chart
BMO Equal Weight U.S. Banks Index ETF (TSE:ZBK.TO) Seasonal Chart
iShares U.S. Financial Services ETF (NYSE:IYG) Seasonal Chart
iShares Edge MSCI Intl Value Factor ETF (AMEX:IVLU) Seasonal Chart
Vanguard S&P Mid-Cap 400 Growth ETF (NYSE:IVOG) Seasonal Chart
Vanguard U.S. Dividend Appreciation Index ETF (TSE:VGG.TO) Seasonal Chart
Science Applications International Corp. (NYSE:SAIC) Seasonal Chart
Zebra Technologies Corp. (NASD:ZBRA) Seasonal Chart
Capstone Mining Corp. (TSE:CS.TO) Seasonal Chart
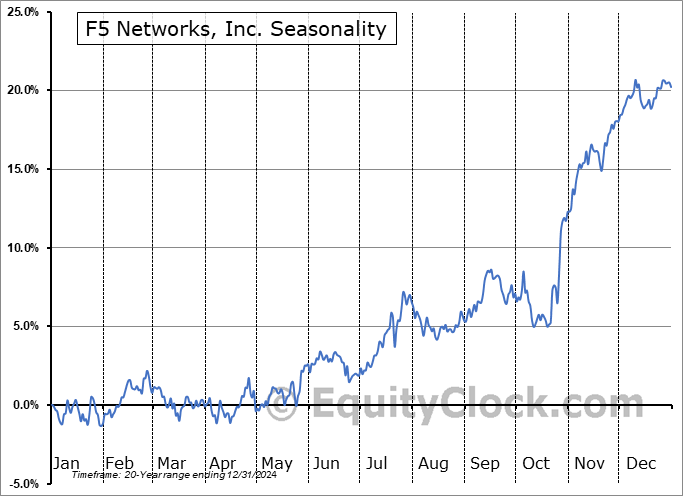
F5 Networks, Inc. (NASD:FFIV) Seasonal Chart
Steel Dynamics, Inc. (NASD:STLD) Seasonal Chart
The Markets
Stocks suffered through another tough session on Friday, giving back much of the prior session’s gain, as investors weighed ongoing inflation concerns and the threat of a recession ahead. The S&P 500 Index traded lower by 2.37% after being rejected again from its declining 20-day moving average at 3695. Declining moving averages at the 20 and 50-day continue to provide hurdles to sell into in order to alleviate equity exposure within portfolios until such point that the trajectory of the intermediate path of the market shifts. While momentum indicators continue to show characteristics of a bearish trend below their middle lines, a slight positive divergence versus price has developed over the past couple of weeks, signalling waning downside pressures. The revelation could potentially be signalling that the worst of this short-term down-leg in the market that has been underway since the middle of August is coming to an end, leading to the test of aforementioned resistance at the 50-day moving average, now at 3933.
Today, in our Market Outlook to subscribers, we discuss the following:
- Weekly look at the large-cap benchmark
- US Retail Sales
- Canada Manufacturing Sales and Inventories
Subscribers can look for this report in their inbox or by clicking on the following link and logging in: Market Outlook for October 17
Not signed up yet? Subscribe now to receive full access to all of the research and analysis that we publish.
Sentiment on Friday, as gauged by the put-call ratio, ended slightly bullish at 0.92.
Seasonal charts of companies reporting earnings today:
S&P 500 Index
TSE Composite
| Sponsored By... |

|


