Stock Market Outlook for February 10, 2023

Real Time Economic Calendar provided by Investing.com.
*** Stocks highlighted are for information purposes only and should not be considered as advice to purchase or to sell mentioned securities. As always, the use of technical and fundamental analysis is encouraged in order to fine tune entry and exit points to average seasonal trends.
Stocks Entering Period of Seasonal Strength Today:
Subscribers – Click on the relevant link to view the full profile. Not a subscriber? Signup here.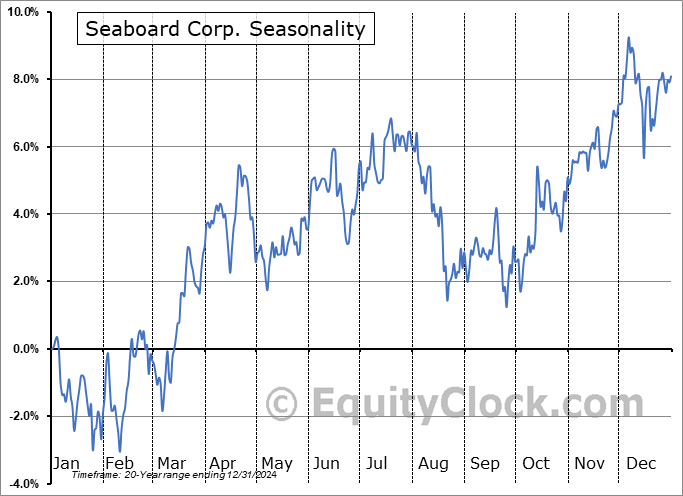
Seaboard Corp. (AMEX:SEB) Seasonal Chart

Schwab International Equity ETF (NYSE:SCHF) Seasonal Chart

WisdomTree International Hedged Quality Dividend Growth Fund (AMEX:IHDG) Seasonal Chart

Ryerson Holding Corp. (NYSE:RYI) Seasonal Chart

TriNet Group, Inc. (NYSE:TNET) Seasonal Chart

Equity Residential Property Trust (NYSE:EQR) Seasonal Chart

Nordic American Tanker Shipping Ltd. (NYSE:NAT) Seasonal Chart

Stoneridge, Inc. (NYSE:SRI) Seasonal Chart

Quaker Chemical Corp. (NYSE:KWR) Seasonal Chart

Advantage Energy Ltd. (TSE:AAV.TO) Seasonal Chart

Activision Blizzard Inc. (NASD:ATVI) Seasonal Chart

Teekay Tankers Ltd. (NYSE:TNK) Seasonal Chart

Brookfield Asset Management Inc. (NYSE:BAM) Seasonal Chart

CNX Resources Corp. (NYSE:CNX) Seasonal Chart

AAON, Inc. (NASD:AAON) Seasonal Chart

Invesco Global Water ETF (NASD:PIO) Seasonal Chart

iShares MSCI Europe IMI Index ETF (CAD-Hedged) (TSE:XEH.TO) Seasonal Chart
The Markets
Stocks reversed early session gains to close lower on Thursday as investors continue to consolidate the strength that has been achieved through the first month of the year. The S&P 500 Index closed lower by almost nine-tenths of one percent, ending below the important pivot point at 4100 that had acted as horizontal resistance to the benchmark in the past few months. The benchmark is now reaching back to the cloud of support presented by major moving averages around the 20, 50, and 100-day moving moving averages, largely between 3900 and 4000. Rising trendline support stemming from the October lows can be seen around the similar span. Momentum indicators continue to show signs of rolling over with MACD at risk of charting a bearish crossover below the previous peak that was recorded at the start of December. The recent rally in the benchmark has taken it back to levels from which it broke down from last spring at 4200, therefore the muscle memory in this zone is strong and likely to garner some reaction. Seasonally, the back half of the month is typically one of the weaker timeframes of the year amidst the lack of fundamental catalysts now that earnings season is predominantly complete and we may be setup for a similar gyration lower this time around as well.
Sentiment on Thursday, as gauged by the put-call ratio, ended bullish at 0.87.Today, in our Market Outlook to subscribers, we discuss the following:
Subscribers can look for this report in their inbox or by clicking on the following link and logging in: Market Outlook for February 10 Not signed up yet? Subscribe now to receive full access to all of the research and analysis that we publish.
- NYSE Composite struggling at last year’s breakdown point
- Technical indicators rolling over from levels at which previous market rallies have stalled
- Weekly jobless claims and the health of the labor market
- The state of natural gas supply heading into the period of seasonal strength for the commodity
 Seasonal charts of companies reporting earnings today:


S&P 500 Index


TSE Composite


| Sponsored By... |

|


