Stock Market Outlook for February 15, 2023

Real Time Economic Calendar provided by Investing.com.
*** Stocks highlighted are for information purposes only and should not be considered as advice to purchase or to sell mentioned securities. As always, the use of technical and fundamental analysis is encouraged in order to fine tune entry and exit points to average seasonal trends.
Stocks Entering Period of Seasonal Strength Today:
Subscribers – Click on the relevant link to view the full profile. Not a subscriber? Signup here.
WisdomTree Canada Quality Dividend Growth Index ETF (TSE:DGRC.TO) Seasonal Chart

Amplify YieldShares CWP Dividend & Option Income ETF (AMEX:DIVO) Seasonal Chart

Invesco Total Return Bond ETF (AMEX:GTO) Seasonal Chart

iShares iBoxx $ High Yield ex Oil & Gas Corporate Bond ETF (NASD:HYXF) Seasonal Chart

IQ Hedge Long/Short Tracker ETF (AMEX:QLS) Seasonal Chart
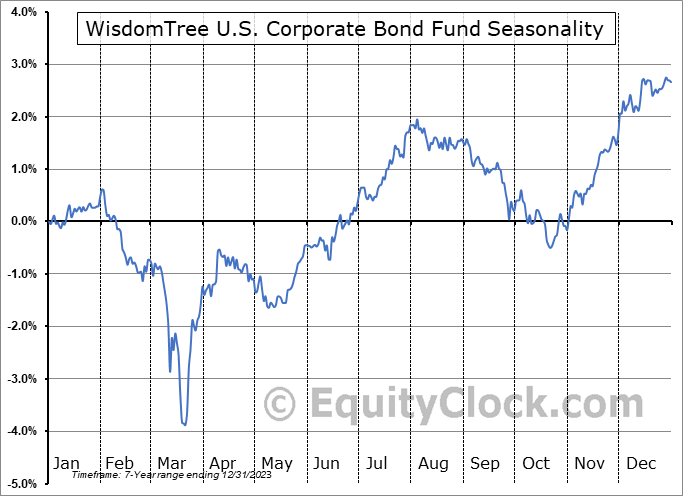
WisdomTree U.S. Corporate Bond Fund (AMEX:WFIG) Seasonal Chart

Invesco Conservative Multi-Asset Allocation ETF (AMEX:PSMC) Seasonal Chart

Vanguard Canadian Long Term Bond Index ETF (TSE:VLB.TO) Seasonal Chart

BMO High Yield US Corporate Bond Index ETF (TSE:ZJK.TO) Seasonal Chart

Exelon Corp. (NASD:EXC) Seasonal Chart
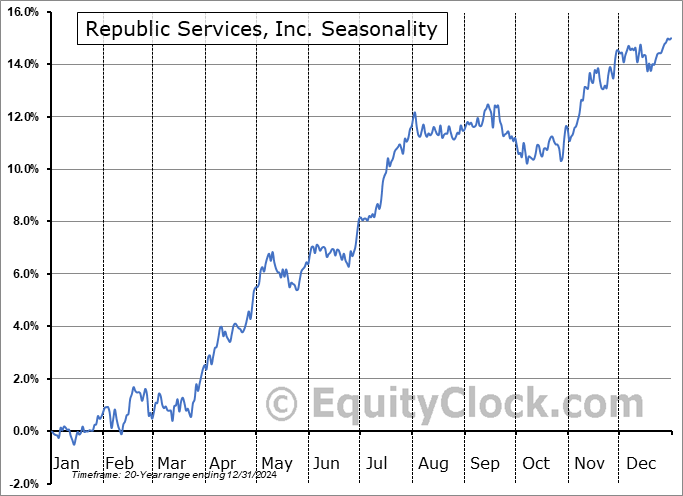
Republic Services, Inc. (NYSE:RSG) Seasonal Chart

Extra Space Storage Inc. (NYSE:EXR) Seasonal Chart
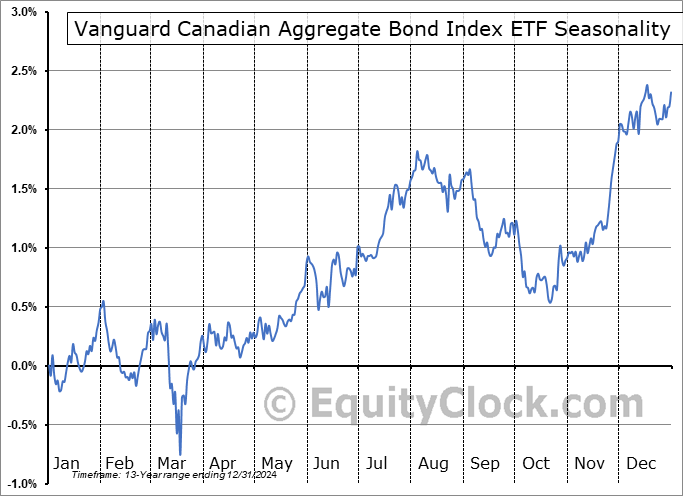
Vanguard Canadian Aggregate Bond Index ETF (TSE:VAB.TO) Seasonal Chart

iShares S&P/TSX Capped Consumer Staples Index ETF (TSE:XST.TO) Seasonal Chart

BMO MSCI Europe High Quality Hedged to CAD Index ETF (TSE:ZEQ.TO) Seasonal Chart

Dominion Energy, Inc. (NYSE:D) Seasonal Chart

iShares Residential Real Estate Capped ETF (NYSE:REZ) Seasonal Chart
The Markets
Stocks closed mixed on Tuesday as investors parsed the stronger than expected read of consumer prices for January. The S&P 500 Index closed lower by a mere three basis points (0.03%), charting a rather indecisive doji candlestick, highlighting the battle between the bulls and the bears around the important pivot point at 4100. A consolidation above the previous horizontal barrier continues to play out as the benchmark finds short-term support at its rising 20-day moving average. The confluence of major moving average remains in the zone between 3900 and 4000, providing a general range to catch the benchmark should it fall, as per seasonal norms, through the remainder of February. MACD remains on a sell signal following Friday’s bearish crossover below its signal line. While strength above 4100 lends itself to further gains so long as this pivotal hurdle does not definitively break, the benchmark continues to maintain a rather neutral view as the bulls and the bears look for greater clarity that a sustainable rising or falling path is upon us.
Sentiment on Tuesday, as gauged by the put-call ratio, ended bullish at 0.95.Today, in our Market Outlook to subscribers, we discuss the following:
Subscribers can look for this report in their inbox or by clicking on the following link and logging in: Market Outlook for February 15 Not signed up yet? Subscribe now to receive full access to all of the research and analysis that we publish.
- US Consumer Price Index (CPI)
- 3-Month Treasury Yield remains on the rise
- The change of shipping volumes to start the year
- The level of the Baltic Dry Index on par with past economic slowdowns/recessions
 Seasonal charts of companies reporting earnings today:


S&P 500 Index


TSE Composite


| Sponsored By... |

|


