Stock Market Outlook for September 25, 2023

Consumers are leaning into credit card debt at an above average rate and, with delinquencies on the rise, the risks to the economy are growing.
*** Stocks highlighted are for information purposes only and should not be considered as advice to purchase or to sell mentioned securities. As always, the use of technical and fundamental analysis is encouraged in order to fine tune entry and exit points to average seasonal trends.
Stocks Entering Period of Seasonal Strength Today:
Subscribers Click on the relevant link to view the full profile. Not a subscriber? Signup here.

Walt Disney Co. (NYSE:DIS) Seasonal Chart

Wells Fargo & Co. (NYSE:WFC) Seasonal Chart

Kelly Services, Inc. (NASD:KELYA) Seasonal Chart

Aegon NV (NYSE:AEG) Seasonal Chart

DXC Technology Company (NYSE:DXC) Seasonal Chart
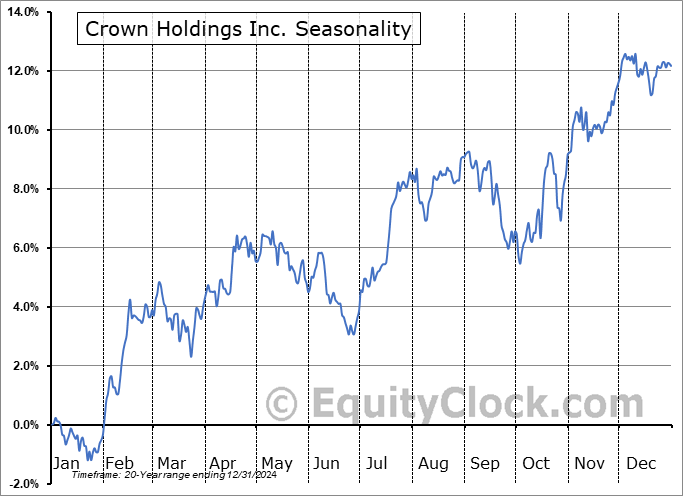
Crown Holdings Inc. (NYSE:CCK) Seasonal Chart

FedEx Corp. (NYSE:FDX) Seasonal Chart

Rockwell Automation (NYSE:ROK) Seasonal Chart

Werner Enterprises, Inc. (NASD:WERN) Seasonal Chart

H&E Equipment Services Inc. (NASD:HEES) Seasonal Chart

iShares China Index ETF (TSE:XCH.TO) Seasonal Chart
The Markets
Stocks closed down for the fourth straight session as investors remained on edge about the recent rise in the cost of borrowing to fresh multi-year highs. The S&P 500 Index closed with a loss of just less than a quarter of one percent, ending near the low of the session. The benchmark continues to move below horizontal support and the neckline to a head-and-shoulders pattern at 4335. The downside target of the bearish setup suggests a theoretical downside move to levels just below 4100, however, previous resistance, now support, at 4200 is bound to put up a big fight. Momentum indicators remain on the decline and have adopted characteristics of a bearish trend. One more week remains in the weakest time of year for stocks that spans the last couple of weeks of September and, thus far, it has certainly lived up to its reputation.

Today, in our Market Outlook to subscribers, we discuss the following:
- Weekly look at the large-cap benchmark
- Net assets on the Fed’s balance sheet has yet to return to the tightening path that was seen last year
- High yield spread
- Business and Consumer loan activity
- The trend of credit card debt
Subscribers can look for this report in their inbox or by clicking on the following link and logging in: Market Outlook for September 25
Not signed up yet? Subscribe now to receive full access to all of the research and analysis that we publish.
Sentiment on Friday, as gauged by the put-call ratio, ended bearish at 1.16.

Seasonal charts of companies reporting earnings today:

S&P 500 Index


TSE Composite


| Sponsored By... |

|


