Stock Market Outlook for November 20, 2023

It is no surprise that the rally in stocks has coincided with the largest expansion of net assets on the Fed’s balance sheet since March.
*** Stocks highlighted are for information purposes only and should not be considered as advice to purchase or to sell mentioned securities. As always, the use of technical and fundamental analysis is encouraged in order to fine tune entry and exit points to average seasonal trends.
Stocks Entering Period of Seasonal Strength Today:
Subscribers Click on the relevant link to view the full profile. Not a subscriber? Signup here.
Ladder Capital Corp. (NYSE:LADR) Seasonal Chart
Gabelli Dividend & Income Trust (NYSE:GDV) Seasonal Chart
iShares S&P Small-Cap 600 Value ETF (NYSE:IJS) Seasonal Chart
iShares Micro-Cap ETF (NYSE:IWC) Seasonal Chart
Vanguard Real Estate ETF (NYSE:VNQ) Seasonal Chart
Barclays Plc (NYSE:BCS) Seasonal Chart
Cisco Systems, Inc. (NASD:CSCO) Seasonal Chart
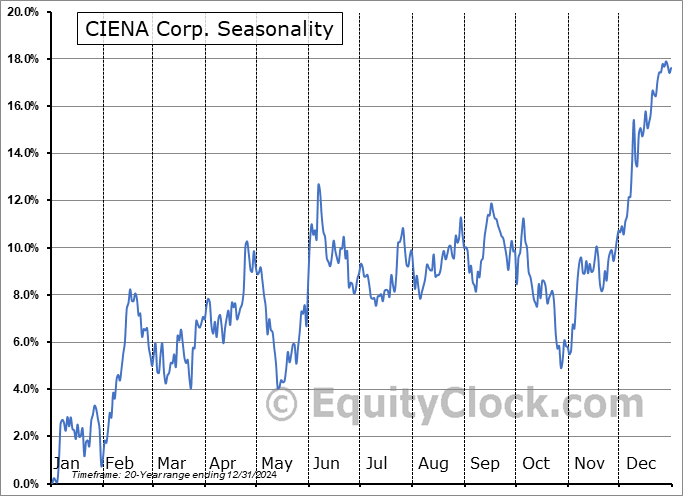
CIENA Corp. (NYSE:CIEN) Seasonal Chart
Parkland Fuel Corp. (TSE:PKI.TO) Seasonal Chart
BorgWarner, Inc. (NYSE:BWA) Seasonal Chart
Mohawk Inds, Inc. (NYSE:MHK) Seasonal Chart
Omega Healthcare Invs, Inc. (NYSE:OHI) Seasonal Chart
Computer Programs and Systems Inc. (NASD:CPSI) Seasonal Chart
Titan Intl, Inc. (NYSE:TWI) Seasonal Chart
Honda Motor Co. Ltd. (NYSE:HMC) Seasonal Chart
Allegheny Technologies (NYSE:ATI) Seasonal Chart
Lazard Ltd (NYSE:LAZ) Seasonal Chart
Builders FirstSource, Inc. (NYSE:BLDR) Seasonal Chart
Energizer Holdings, Inc. (NYSE:ENR) Seasonal Chart
iShares U.S. Home Construction ETF (NYSE:ITB) Seasonal Chart
Invesco Solar ETF (NYSE:TAN) Seasonal Chart
SPDR S&P Metals and Mining ETF (NYSE:XME) Seasonal Chart
Kimco Realty Corp. (NYSE:KIM) Seasonal Chart
Public Storage, Inc. (NYSE:PSA) Seasonal Chart
Wheaton Precious Metals Corp. (NYSE:WPM) Seasonal Chart
First Quantum Minerals Ltd. (TSE:FM.TO) Seasonal Chart
Interpublic Grp Of Cos (NYSE:IPG) Seasonal Chart
ArcelorMittal SA (NYSE:MT) Seasonal Chart
Teck Resources Ltd. (NYSE:TECK) Seasonal Chart
The Markets
Stocks edged higher on Friday as a rebound in the beaten down energy sector helped to support broader risk sentiment. The S&P 500 Index ended higher by just over a tenth of one percent, still showing a bit of hesitation around psychological resistance at 4500 as near-term buying demand becomes exhausted. The benchmark is increasingly inching towards overbought territory according to the Relative Strength Index (RSI) as price becomes stretched in the near-term, but this is indication of a bullish trend rather than anything to be concerned of over an intermediate-term timeframe. A short-term period of digestion of recent strength is still desirable before we get into the month of December, but, with positive tendencies for stocks persisting through the US Thanksgiving holiday week ahead, pegging when a short-term pullback may occur continues to be a difficult task. Levels of support below the benchmark remain numerous, including the levels of gap support charted in recent weeks, along with major moving averages, keeping the risk-reward on the side of the bulls over an intermediate-term timeframe (eg. through the end of the year).
Today, in our Market Outlook to subscribers, we discuss the following:
- Weekly look at the large-cap benchmark
- The breakout of Technology and Communication Services
- Industrials back above resistance, but industries more enticing than the broader sector exist
- Net assets held by the Fed
- The break of the trend of outperformance of Junk Bonds over Investment Grade Corporate Bonds
- US Housing Starts and the desired exposure in the construction industry
Subscribers can look for this report in their inbox or by clicking on the following link and logging in: Market Outlook for November 20
Not signed up yet? Subscribe now to receive full access to all of the research and analysis that we publish.
Sentiment on Friday, as gauged by the put-call ratio, ended slightly bullish at 0.89.
Seasonal charts of companies reporting earnings today:
S&P 500 Index
TSE Composite
| Sponsored By... |

|


