Stock Market Outlook for October 30, 2024

Home prices are rolling over earlier than average heading into the fall, a trajectory that bodes poorly for wealth creation through the back half of the year.
*** Stocks highlighted are for information purposes only and should not be considered as advice to purchase or to sell mentioned securities. As always, the use of technical and fundamental analysis is encouraged in order to fine tune entry and exit points to average seasonal trends.
Stocks Entering Period of Seasonal Strength Today:
Subscribers Click on the relevant link to view the full profile. Not a subscriber? Signup here.
iShares Morningstar Small-Cap Growth ETF (NYSE:ISCG) Seasonal Chart
iShares Global Timber & Forestry ETF (NASD:WOOD) Seasonal Chart
Beacon Roofing Supply Inc. (NASD:BECN) Seasonal Chart
Acco Brands Corp. (NYSE:ACCO) Seasonal Chart
iRobot Corp. (NASD:IRBT) Seasonal Chart
Forestar Group Inc. (NYSE:FOR) Seasonal Chart
Bruker Corp. (NASD:BRKR) Seasonal Chart
Avnet, Inc. (NASD:AVT) Seasonal Chart
Labrador Iron Ore Royalty Corp. (TSE:LIF.TO) Seasonal Chart
Cemex SA (NYSE:CX) Seasonal Chart
Western Digital Corp. (NASD:WDC) Seasonal Chart
Advanced Semiconductor (NYSE:ASX) Seasonal Chart
iShares S&P Mid-Cap 400 Value ETF (NYSE:IJJ) Seasonal Chart
iShares Russell 1000 ETF (NYSE:IWB) Seasonal Chart
The Markets
Stocks closed mixed on Tuesday as traders waited for earnings results from a few of the technology titans after the closing bell and through the days ahead. The S&P 500 Index ended higher by just less than two-tenths of one percent, remaining within close proximity of short term support at the rising 20-day moving average (5799). Over the past couple of weeks, the benchmark has shown a cap at 5870, resulting in an ultra-short-term topping pattern that projects a downside target of 5745. A narrowing range from the trading action over the past 8 sessions is apparent, the peak of which was tested into Tuesday’s close. Despite the recent stall, this market is showing greater evidence of support than resistance over an intermediate-term timeframe, presenting characteristics of a bullish trend. What is concerning to the prevailing path is the waning of upside momentum, something that we have seen more evidence of with another MACD sell signal in the past few days; the momentum indicator has shown a negative divergence versus price through the current calendar year, highlighting the fading enthusiasm towards the risk profile that equities encompass. The risk-reward, broadly, remains unattractive. We continue to like the groups that are on our list of Accumulate candidates, but there are certainly segments of the market to Avoid. With the start of the best six months of the year for stocks slated to get underway, there is a need from a seasonal perspective to ramp up risk exposure at some point.
Today, in our Market Outlook to subscribers, we discuss the following:
- Job Openings and Labor Turnover Survey (JOLTs) and the investment implications within
- The abnormal rise in layoffs/discharges in September and the light that remains on defensive assets
- The abnormal August decline in Home Prices
Subscribers can look for this report in their inbox or by clicking on the following link and logging in: Market Outlook for October 30
Not signed up yet? Subscribe now to receive full access to all of the research and analysis that we publish.
Sentiment on Tuesday, as gauged by the put-call ratio, ended slightly bullish at 0.89.
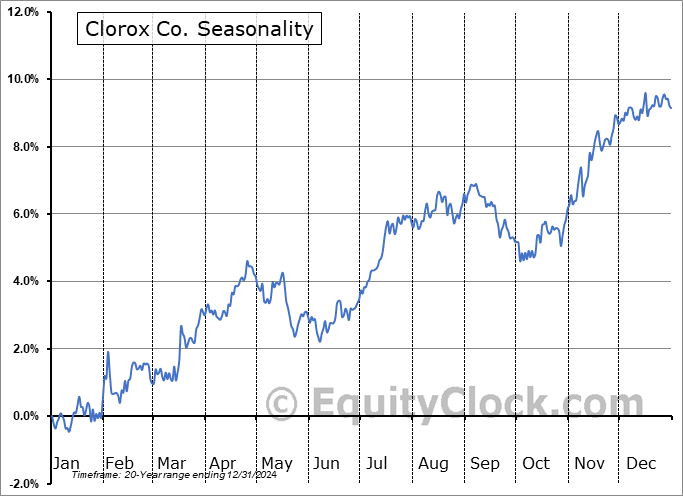
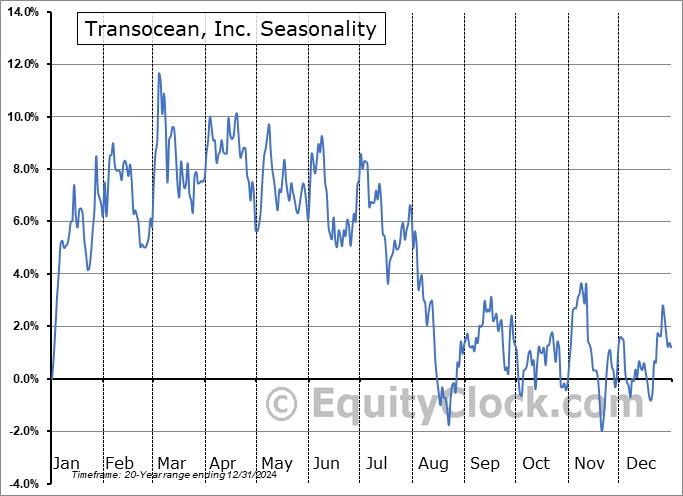
Seasonal charts of companies reporting earnings today:
S&P 500 Index
TSE Composite
| Sponsored By... |

|


