Stock Market Outlook for April 13, 2026

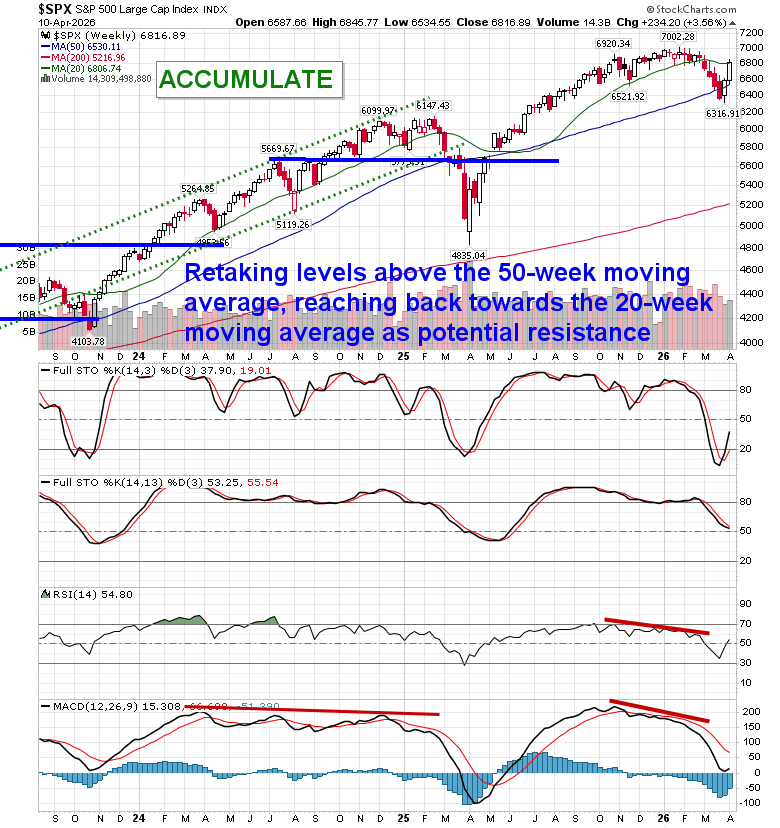
S&P 500 testing the 20-week moving average, providing a critical test to the intermediate-term trend.
*** Stocks highlighted are for information purposes only and should not be considered as advice to purchase or to sell mentioned securities. As always, the use of technical and fundamental analysis is encouraged in order to fine tune entry and exit points to average seasonal trends.
Stocks Entering Period of Seasonal Strength Today:
Subscribers Click on the relevant link to view the full profile. Not a subscriber? Signup here.
Stock Highlight: |
|

Marker Therapeutics, Inc. (NASD:MRKR) Seasonal Chart |
|

Invesco Dynamic Software ETF (AMEX:IGPT) Seasonal Chart

First Trust Health Care AlphaDEX Fund (NYSE:FXH) Seasonal Chart
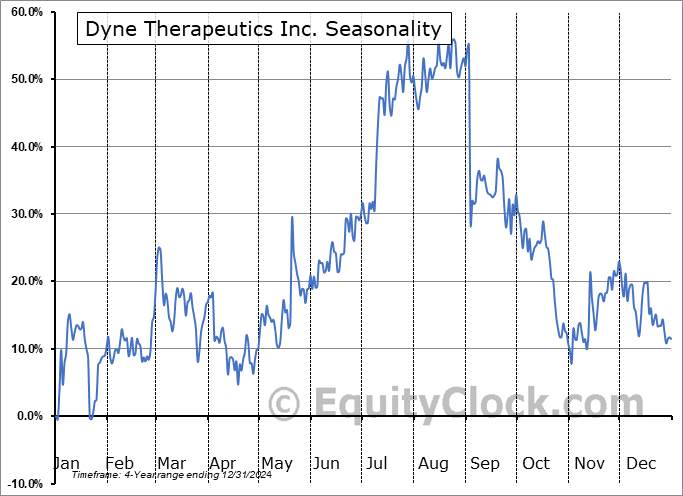
Dyne Therapeutics Inc. (NASD:DYN) Seasonal Chart

Manhattan Bridge Capital Inc. (NASD:LOAN) Seasonal Chart
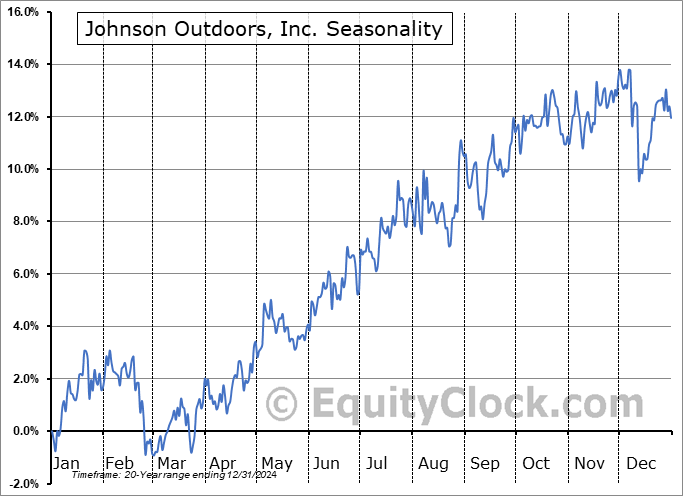
Johnson Outdoors, Inc. (NASD:JOUT) Seasonal Chart

Sypris Solutions, Inc. (NASD:SYPR) Seasonal Chart

Baker Hughes Company (NASD:BKR) Seasonal Chart
Disclaimer: Comments and opinions offered in this report are for information only. They should not be considered as advice to purchase or to sell mentioned securities. Data offered is believed to be accurate, but is not guaranteed.
The Markets
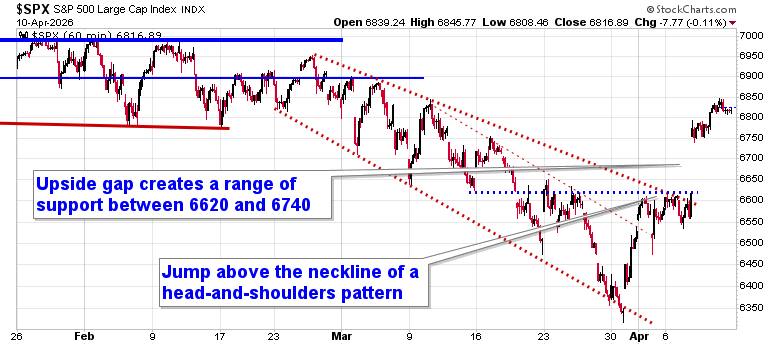
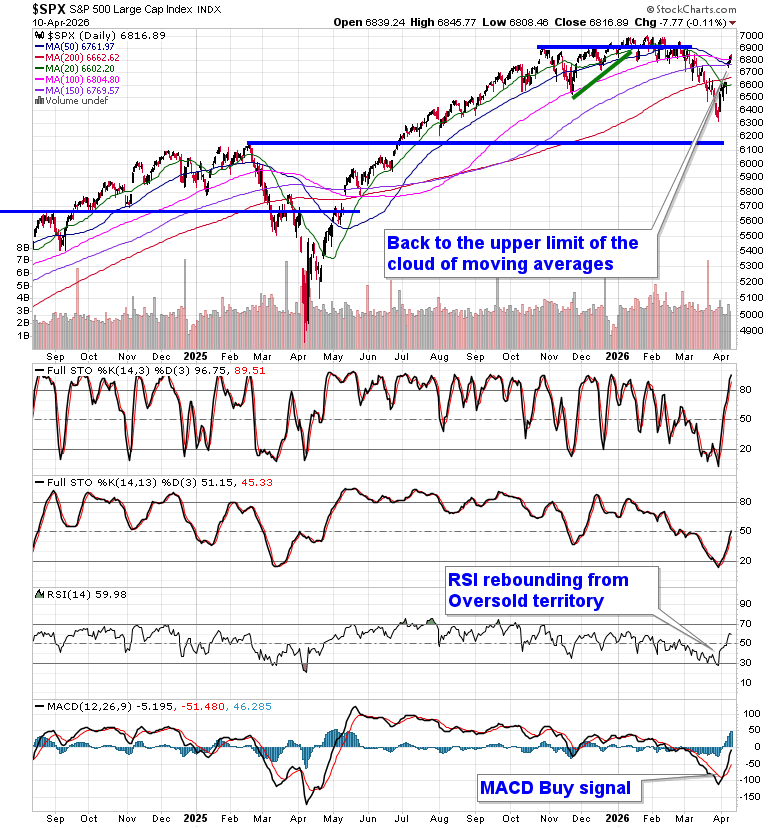
Stocks slipped slightly on Friday developments pertaining to the Iran ceasefire continue to be monitored. The S&P 500 Index closed down by a tenth of a percent, leaving Wednesday’s gap that was opened between 6620 and 6740 unfilled. A head-and-shoulders bottoming pattern that saw its neckline around 6620 remains in play, a technical setup that proposes an upside resolution to 6900, or back to the important pivot point in the market that we had highlighted in January and February. A fill of the open gap is still a probability before the upside target that the bullish setup projects is achieved, but it seems likely that the reaction to earnings through the weeks ahead will dictate whether this gap fill comes sooner or later. The 200-day moving average, which had been heavily scrutinized by many in recent weeks, has been retaken and the upper limit of the cloud of moving averages at 6800 is being tested. In the Seasonal Advantage Portfolio (which is strongly higher YTD and back to its high watermark that was charted in February) that we manage for clients at CastleMoore, we continue to be fully exposed to risk (stocks) after flipping from our low volatility stance around the end of March and our performance is benefitting. The conflict in Iran remains a wildcard and we are running down our cues that would warrant a more defensive posture in risk assets, but the net of all developments following the action from the past couple of weeks between technicals, fundamentals, and seasonals have provided the edge to an upside bias (and it has been working). Subscribers can view the updated list of themes in our chart books to either Accumulate or Avoid that we continue to gear portfolios towards.
Today, in our Market Outlook to subscribers, we discuss the following:
- Market & Technical Setup
- Inflation & Macro Backdrop
- Portfolio Implications (Inflation & Rates)
- Economic Signals (Canada Employment Focus)
- Sector & Market Positioning
- Labor Market Sector Trends (Canada)
- Sentiment & Positioning
Subscribers can look for this report in their inbox or by clicking on the following link and logging in: Market Outlook for April 13
Not signed up yet? Subscribe now to receive full access to all of the research and analysis that we publish
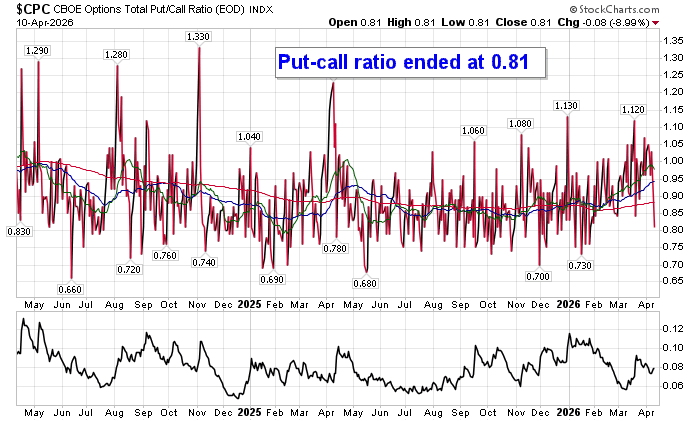
Sentiment on Friday, as gauged by the put-call ratio, ended bullish at 0.81.
Seasonal charts of companies reporting earnings today:


S&P 500 Index
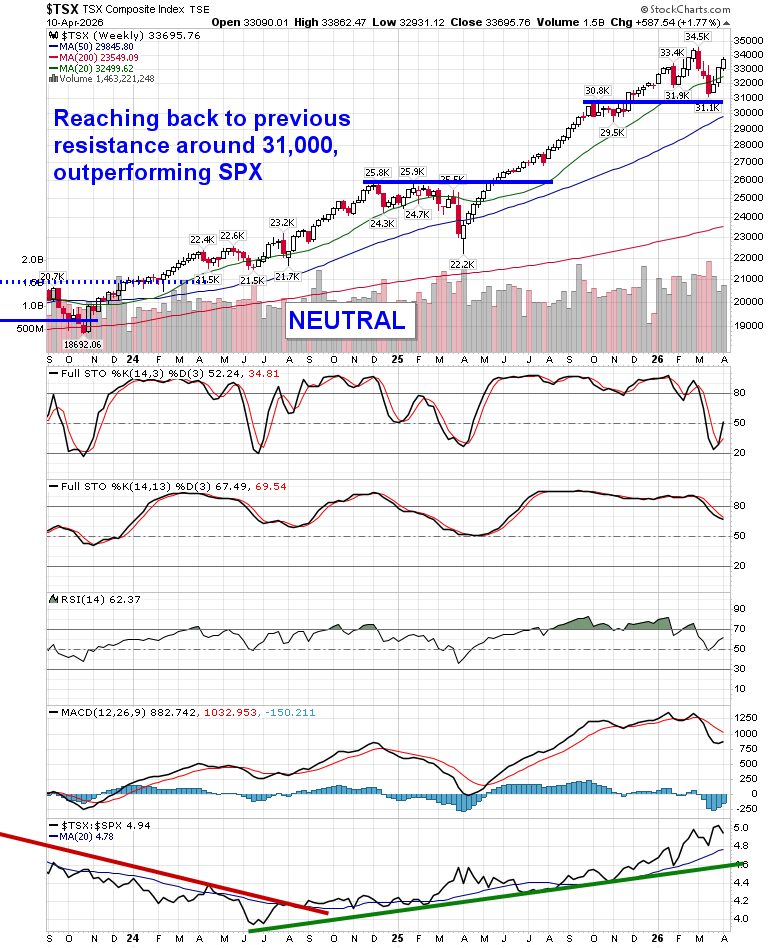
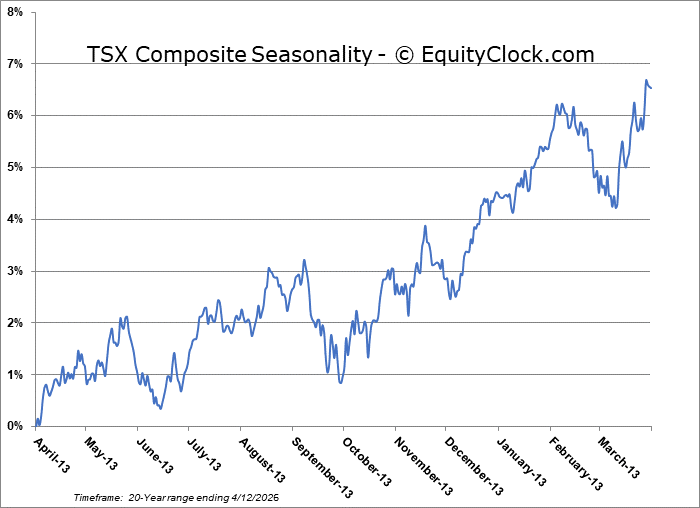
TSE Composite
| Sponsored By... |

|


