Stock Market Outlook for April 14, 2026

After playing the contrarian and betting aggressively into the seasonally favourable month of April for stocks, we are starting to lean cautious.
*** Stocks highlighted are for information purposes only and should not be considered as advice to purchase or to sell mentioned securities. As always, the use of technical and fundamental analysis is encouraged in order to fine tune entry and exit points to average seasonal trends.
Stocks Entering Period of Seasonal Strength Today:
Subscribers Click on the relevant link to view the full profile. Not a subscriber? Signup here.
Stock Highlight: |
|

Trisura Group Ltd. (TSE:TSU.TO) Seasonal Chart |
|

KKR & Co Inc (NYSE:KKR) Seasonal Chart
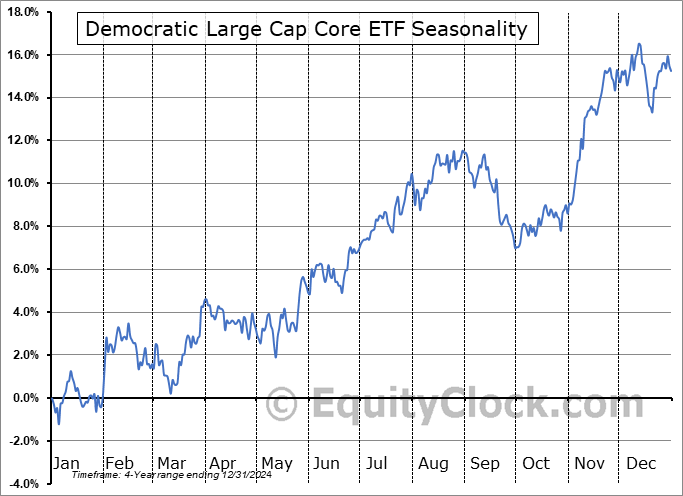
Democratic Large Cap Core ETF (NASD:DEMZ) Seasonal Chart
Disclaimer: Comments and opinions offered in this report are for information only. They should not be considered as advice to purchase or to sell mentioned securities. Data offered is believed to be accurate, but is not guaranteed.
The Markets
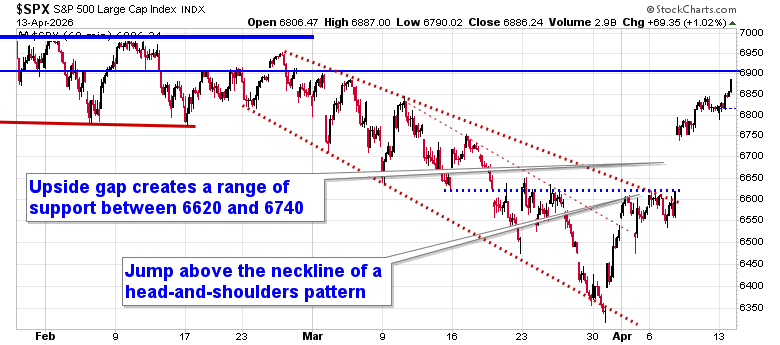
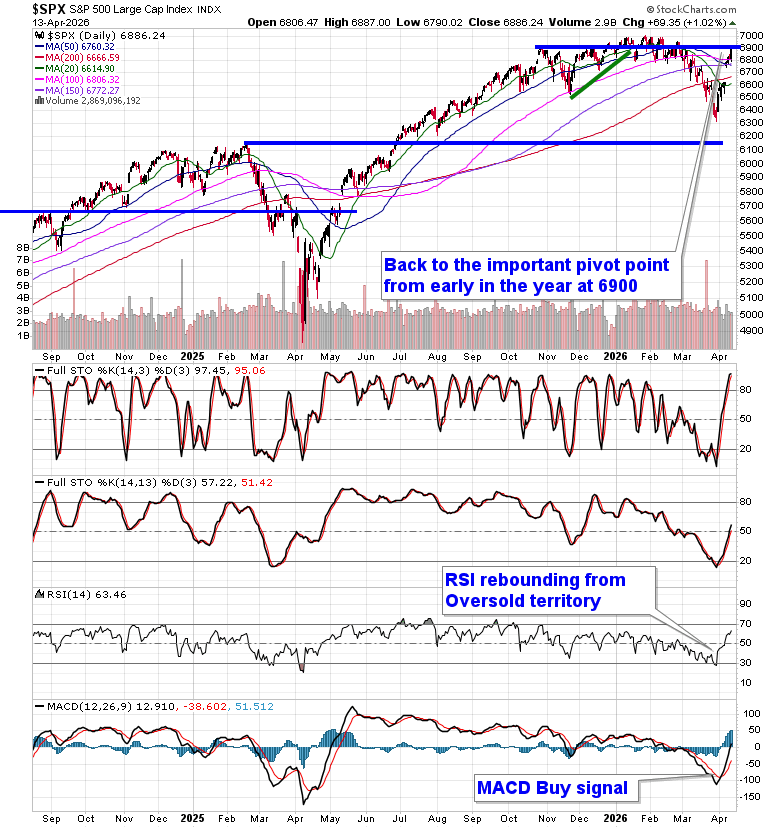
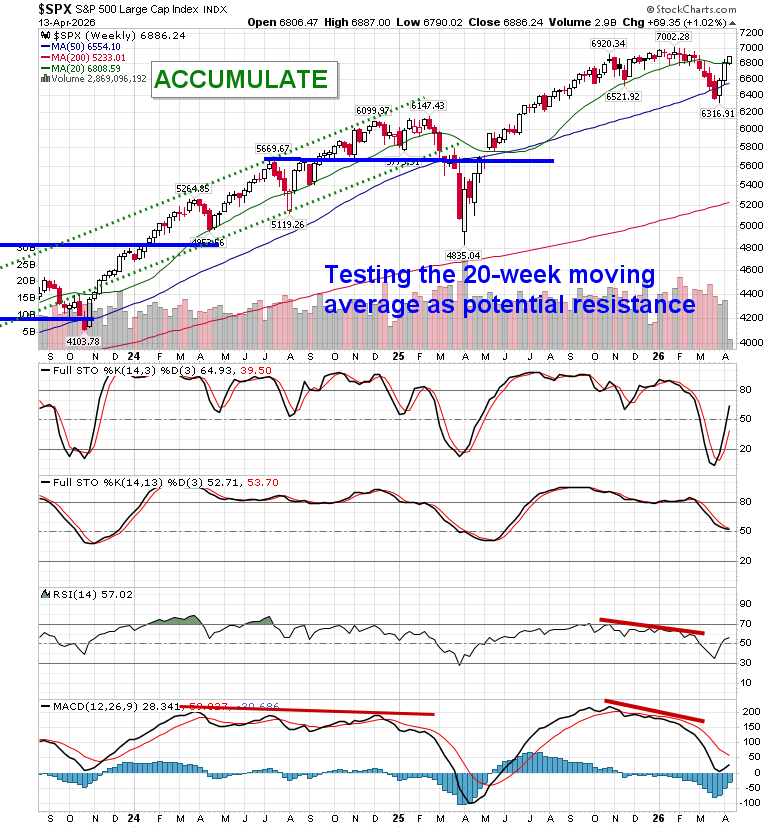
Stocks shook off concerns related to a failure to achieve a peace deal between the US and Iran over the weekend, trading high and fueling short covering in some of the most beaten down segments of the market (eg. Software, Private Equity Managers). The S&P 500 Index closed up by just over one percent, leaving last Wednesday’s gap that was opened between 6620 and 6740 unfilled. A head-and-shoulders bottoming pattern that saw its neckline around 6620 remains in play, a technical setup that proposes an upside resolution to 6900, or back to the important pivot point in the market that we had highlighted in January and February. This hurdle is now mere points away. The benchmark is marginally above the upper limit of the cloud of moving averages at 6800. In the Seasonal Advantage Portfolio (which is strongly higher YTD and back to its high watermark that was charted in February) that we manage for clients at CastleMoore, we continue to be fully exposed to risk (stocks) after flipping from our low volatility stance around the end of March and our performance is benefitting. The conflict in Iran remains a wildcard and we are running down our cues that would warrant a more defensive posture in risk assets. Last week, for the first time in a long time, our chart books leaned negative, providing segments of the market that are providing setups to shoot against (short). Subscribers can view the updated list of themes in our chart books to either Accumulate or Avoid that we continue to gear portfolios towards.
Want to know which areas of the market to buy or sell? Our Weekly Chart Books have just been updated, providing a clear Accumulate, Avoid, or Neutral rating for currencies, cryptocurrencies, commodities, broad markets, and subsectors/industries of the market. Subscribers can login and click on the relevant links to access.
- Currencies
- Cryptocurrencies
- Commodities
- Major Benchmarks
- Sub-sectors / Industries
- ETFs: Bonds | Commodities | Equity Markets | Industries | Sectors
Subscribe now.
Today, in our Market Outlook to subscribers, we discuss the following:
- Market & Technical Outlook
- Shift in Strategy (Important)
- Macro & Economic Backdrop
- Sector Positioning
- New “Avoid” Candidates
- New Accumulate Opportunity and our entire list of Accumulate candidates
- Key Themes Going Forward
Subscribers can look for this report in their inbox or by clicking on the following link and logging in: Market Outlook for April 14
Not signed up yet? Subscribe now to receive full access to all of the research and analysis that we publish
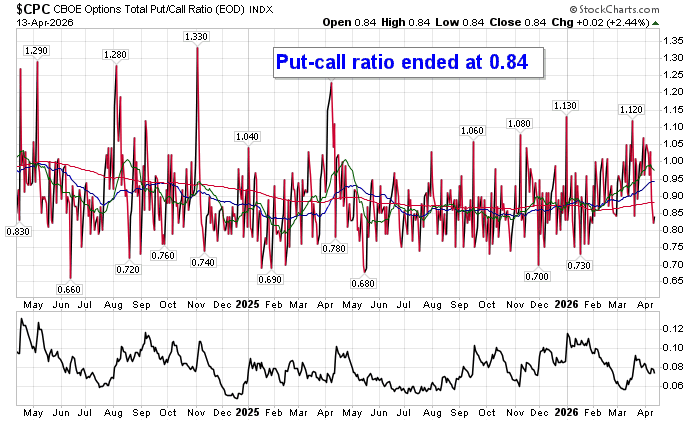
Sentiment on Monday, according to the put-call ratio, ended bullish at 0.84.
Seasonal charts of companies reporting earnings today:


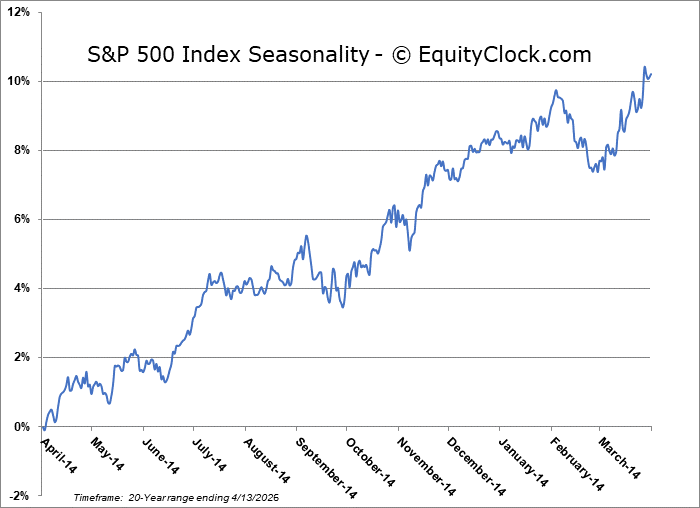
S&P 500 Index
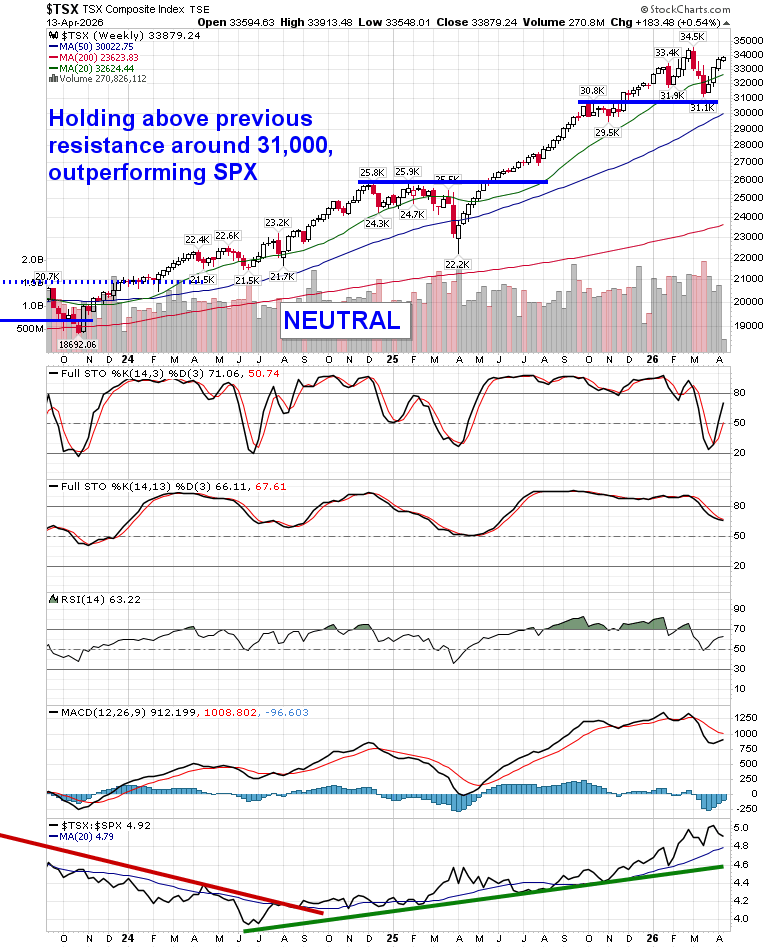
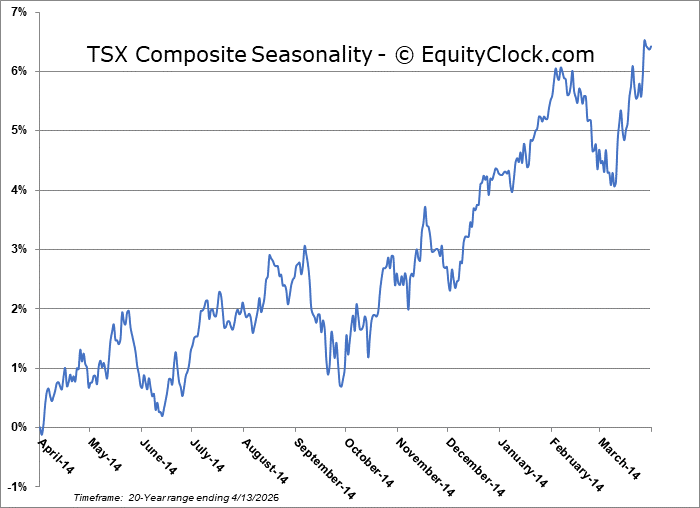
TSE Composite
| Sponsored By... |

|


