Stock Market Outlook for May 27, 2026

The risks to the market heading into the summer have not gone away with Oil and interest rates continuing to hold significant levels of support.
*** Stocks highlighted are for information purposes only and should not be considered as advice to purchase or to sell mentioned securities. As always, the use of technical and fundamental analysis is encouraged in order to fine tune entry and exit points to average seasonal trends.
Stocks Entering Period of Seasonal Strength Today:
Subscribers Click on the relevant link to view the full profile. Not a subscriber? Signup here.
Stock Highlight: |
|

TeraWulf Inc. (NASD:WULF) Seasonal Chart |
|

iShares Russell Top 200 ETF (NYSE:IWL) Seasonal Chart

Eli Lilly & Co. (NYSE:LLY) Seasonal Chart

T2 Metals Corp. (TSXV:TWO.V) Seasonal Chart
Disclaimer: Comments and opinions offered in this report are for information only. They should not be considered as advice to purchase or to sell mentioned securities. Data offered is believed to be accurate, but is not guaranteed.
The Markets
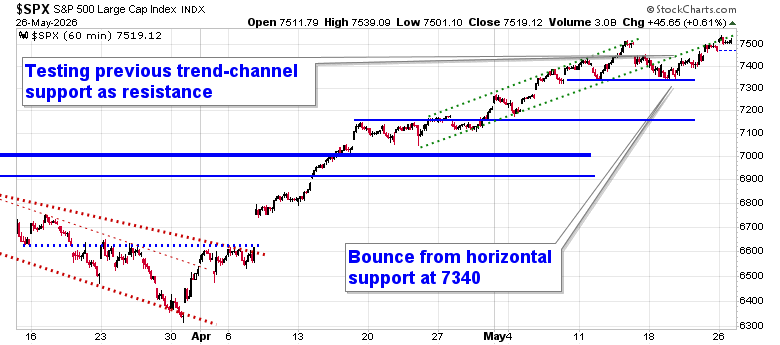
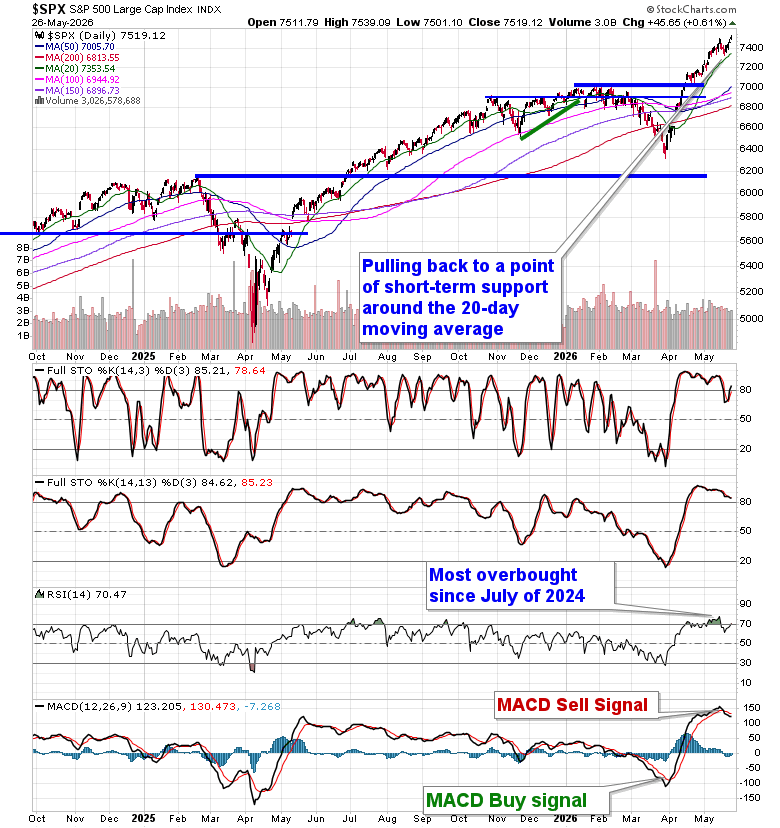
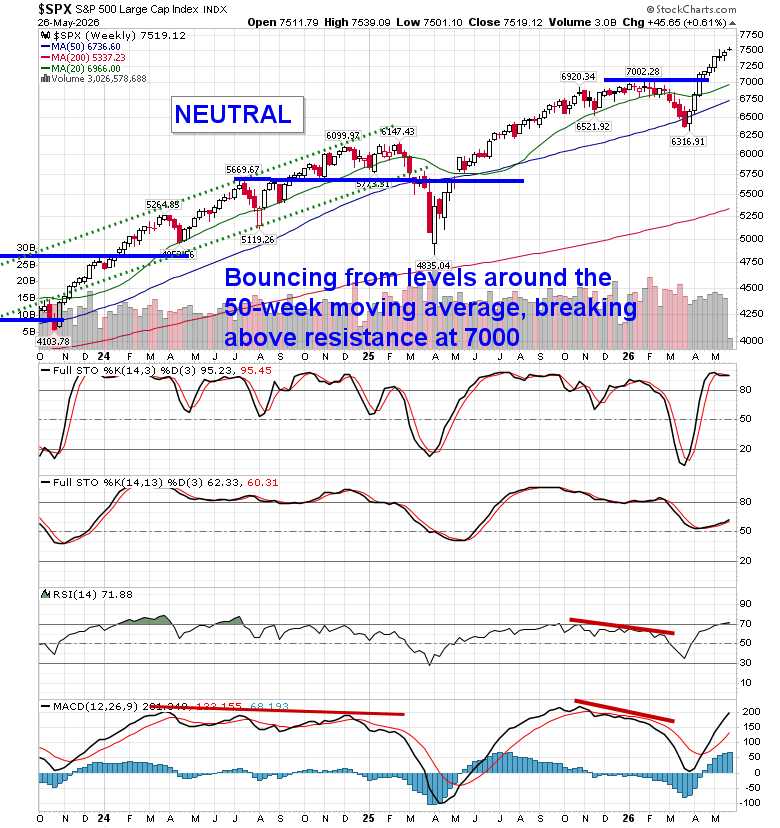
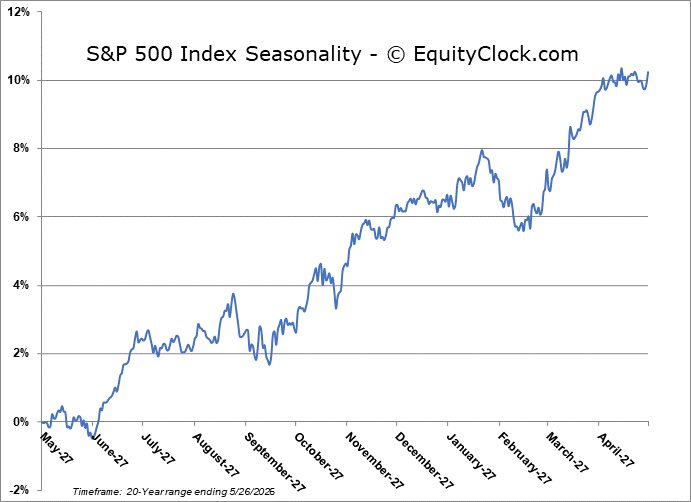
A drop in the price of oil and a pullback in the cost of borrowing amidst optimism that a deal will be reached in the US-Iran conflict had equities on an upswing to start the holiday shortened week. The S&P 500 Index closed higher by just over six-tenths of one percent, charting a fresh record high. The benchmark is staying elevated above short-term horizontal support at 7340, a breakdown below which would project a move back towards the upper limit of the end of April consolidation span around 7150. While the character of the market remains where levels of resistance hold less weight than levels of support, there are certainly fractures around the periphery as breadth in the market narrows. A daily MACD sell signal was triggered in the past week, closing a long trade with respect to this momentum indicator that began at the start of April. In the Seasonal Advantage Portfolio that we manage for clients at CastleMoore, we continue to hit new high watermarks and we have prepared for a more volatile/risk-off market framework for the back half of May and into the month of June. The conflict/deal in Iran is the ongoing wildcard and the cues that we have been following that warranted moving towards a more defensive posture in risk assets have not gone away, even with the gyrations in the bond and equity markets to start the week. Subscribers can view the themes in our chart books to either Accumulate or Avoid that we continue to gear portfolios towards.
Want to know which areas of the market to buy or sell? Our Weekly Chart Books have just been updated, providing a clear Accumulate, Avoid, or Neutral rating for currencies, cryptocurrencies, commodities, broad markets, and subsectors/industries of the market. Subscribers can login and click on the relevant links to access.
- Currencies
- Cryptocurrencies
- Commodities
- Major Benchmarks
- Sub-sectors / Industries
- ETFs: Bonds | Commodities | Equity Markets | Industries | Sectors
Subscribe now.
Today, in our Market Outlook to subscribers, we discuss the following:
- Our weekly chart books update, along with our list of all segments of the market to either Accumulate or Avoid
- Other Notes
Subscribers can look for this report in their inbox or by clicking on the following link and logging in: Market Outlook for May 27
Not signed up yet? Subscribe now to receive full access to all of the research and analysis that we publish
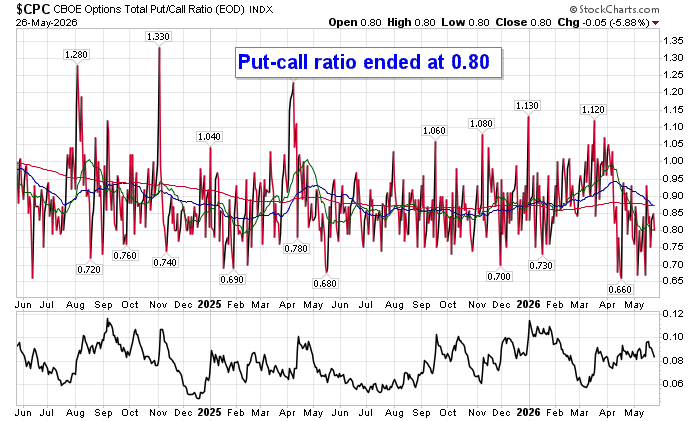
Sentiment on Tuesday, as gauged by the put-call ratio, ended bullish at 0.80.
Seasonal charts of companies reporting earnings today:




S&P 500 Index
TSE Composite
| Sponsored By... |

|


