Stock Market Outlook for September 8, 2026

New year-to-date lows in the VIX highlights that the market has yet to become unhinged, as is notorious for this time of year.
*** Stocks highlighted are for information purposes only and should not be considered as advice to purchase or to sell mentioned securities. As always, the use of technical and fundamental analysis is encouraged in order to fine tune entry and exit points to average seasonal trends.
Stocks Entering Period of Seasonal Strength Today:
Subscribers Click on the relevant link to view the full profile. Not a subscriber? Signup here.
Stock Highlight: |
|

Bloom Energy Corp. (NYSE:BE) Seasonal Chart |
|

Griffon Corp. (NYSE:GFF) Seasonal Chart

Global X U.S. Infrastructure Development ETF (AMEX:PAVE) Seasonal Chart

Chefs’ Warehouse, Inc. (NASD:CHEF) Seasonal Chart

Schwab US Small-Cap ETF (NYSE:SCHA) Seasonal Chart

Xencor, Inc. (NASD:XNCR) Seasonal Chart

Ingersoll Rand Inc (NYSE:IR) Seasonal Chart

Acnb (NASD:ACNB) Seasonal Chart

Genesco, Inc. (NYSE:GCO) Seasonal Chart

BMO Equal Weight U.S. Banks Index ETF (TSE:ZBK.TO) Seasonal Chart

iShares U.S. Insurance ETF (NYSE:IAK) Seasonal Chart

Illinois Tool Works, Inc. (NYSE:ITW) Seasonal Chart

Amerco (NYSE:UHAL) Seasonal Chart

Cohu, Inc. (NASD:COHU) Seasonal Chart
Disclaimer: Comments and opinions offered in this report are for information only. They should not be considered as advice to purchase or to sell mentioned securities. Data offered is believed to be accurate, but is not guaranteed.
Note: Monday is Labor Day (markets are closed) and, as a result, our next report will be released on Tuesday.
The Markets
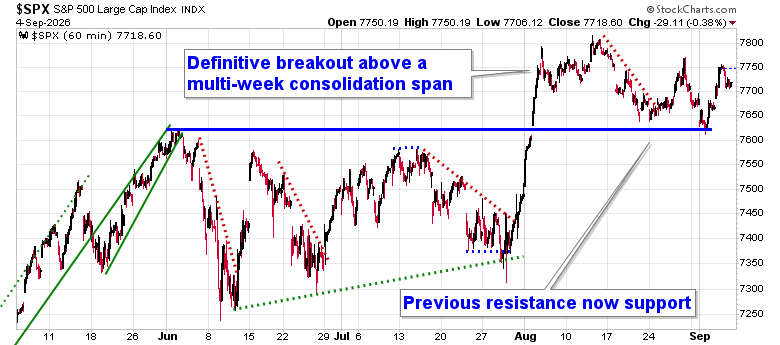
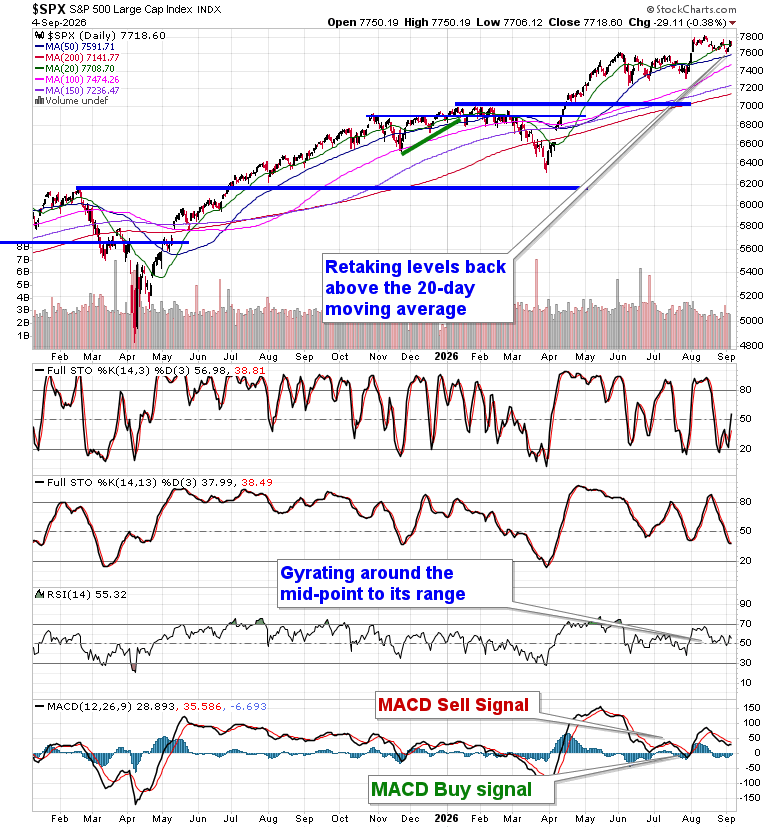
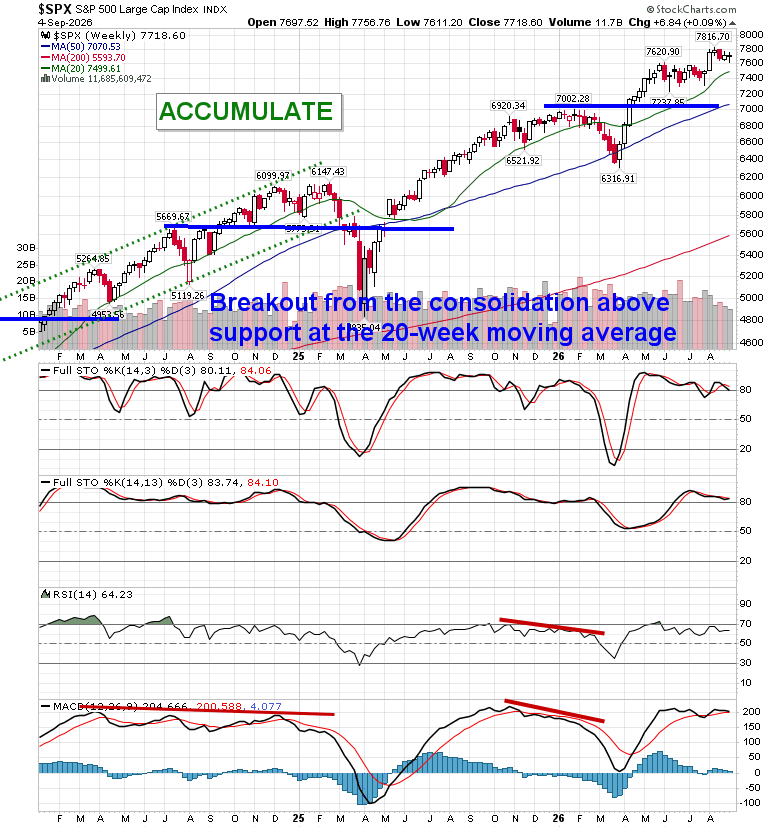
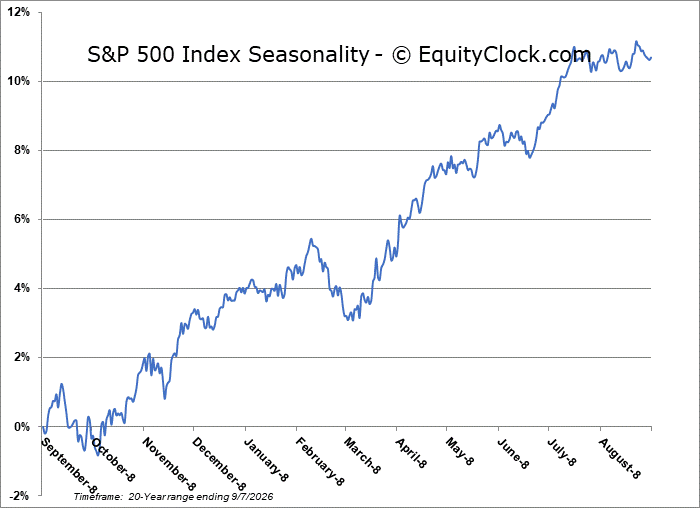
A tick higher in the cost of borrowing following headlines of strong employment growth (which were highly manipulated) had stocks under pressure on Friday. The S&P 500 Index slipped by around four-tenths of one percent, remaining within this consolidation range that has spanned the past month above previous resistance at 7620. A short-term bull-flag pattern remains intact, suggesting further upside to be expected. The benchmark closes the week at the 20-day moving average (7708), a hurdle that was briefly violated intraweek. The backdrop continues to warrant a bullish tilt toward stocks, for now, heading further into what is often a volatile period for equity performance in the month of September. In the Seasonal Advantage Portfolio that we manage for clients at CastleMoore, we continue to hold an elevated exposure to stocks, aligning with the optimism that the manufacturing economy is expressing. The period of volatility in the equity market is starting to impose some erratic results, but there is some leeway on the calendar before the peak period of weakness rolls around starting in the middle of September. Subscribers can view what we are targeting in our list of market segments to either Accumulate or Avoid.
Today, in our Market Outlook to subscribers, we discuss the following:
- Weekly look at the large-cap benchmark
- New YTD lows on the VIX
- US Employment Situation and the investment implications within
- Canada Labor Force Survey
- Interest Rates and the US Dollar during Mid-Term Election years
- Gold
Subscribers can look for this report in their inbox or by clicking on the following link and logging in: Market Outlook for September 8
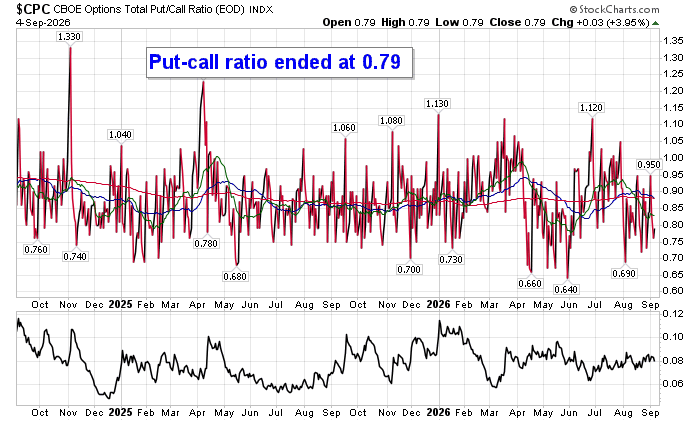
Sentiment on Friday, as gauged by the put-call ratio, ended bullish at 0.79.
Seasonal charts of companies reporting earnings today:





S&P 500 Index
TSE Composite
| Sponsored By... |

|


