Stock Market Outlook for May 11, 2026

The loss of earnings season distraction could pose a problem for stocks in the weeks ahead.
*** Stocks highlighted are for information purposes only and should not be considered as advice to purchase or to sell mentioned securities. As always, the use of technical and fundamental analysis is encouraged in order to fine tune entry and exit points to average seasonal trends.
Stocks Entering Period of Seasonal Strength Today:
Subscribers Click on the relevant link to view the full profile. Not a subscriber? Signup here.
Stock Highlight: |
|

Invesco WilderHill Clean Energy ETF (NYSE:PBW) Seasonal Chart |
|

Invesco QQQ Trust (NASD:QQQ) Seasonal Chart

SPDR Barclays Long Term Corporate Bond ETF (AMEX:SPLB) Seasonal Chart

Vanguard Growth ETF (NYSE:VUG) Seasonal Chart
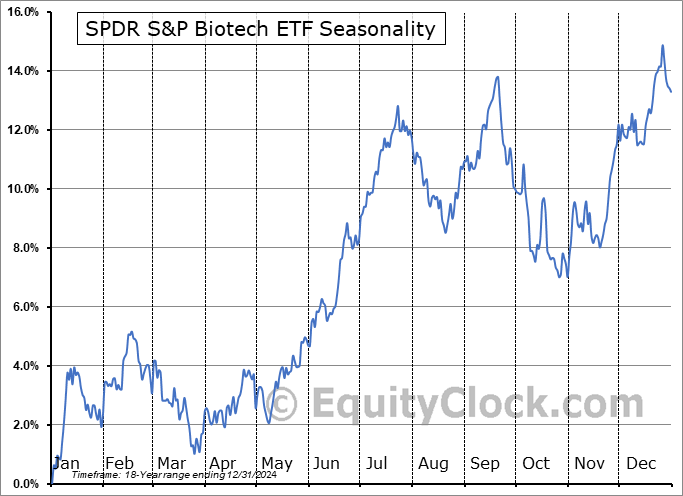
SPDR S&P Biotech ETF (NYSE:XBI) Seasonal Chart

Automotive Properties REIT (TSE:APR/UN.TO) Seasonal Chart

Invesco S&P 500 Momentum ETF (AMEX:SPMO) Seasonal Chart

Twist Bioscience Corp. (NASD:TWST) Seasonal Chart

American States Water Co. (NYSE:AWR) Seasonal Chart

Palantir Technologies, Inc. (NASD:PLTR) Seasonal Chart

ARK Innovation ETF (AMEX:ARKK) Seasonal Chart

iShares Nasdaq Biotechnology ETF (NASD:IBB) Seasonal Chart

iShares U.S. Healthcare ETF (NYSE:IYH) Seasonal Chart

Vanguard Mega Cap Growth ETF (NYSE:MGK) Seasonal Chart

iShares Exponential Technologies ETF (NASD:XT) Seasonal Chart
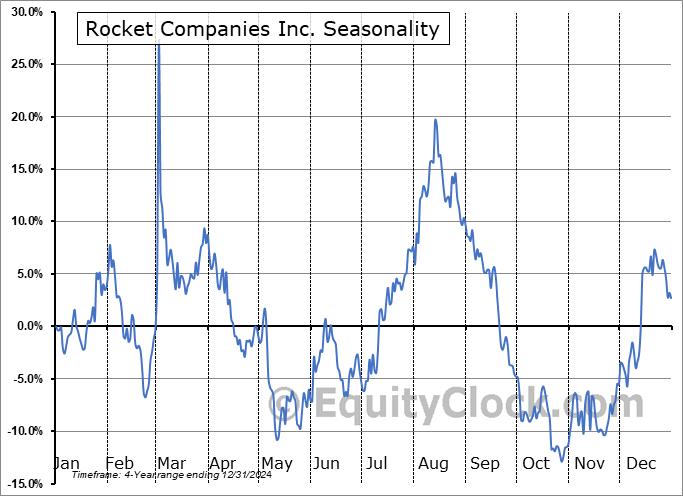
Rocket Companies Inc. (NYSE:RKT) Seasonal Chart
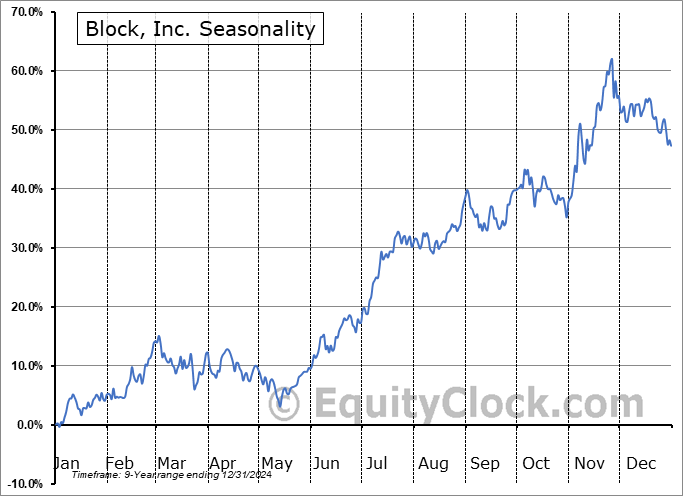
Block, Inc. (NYSE:XYZ) Seasonal Chart
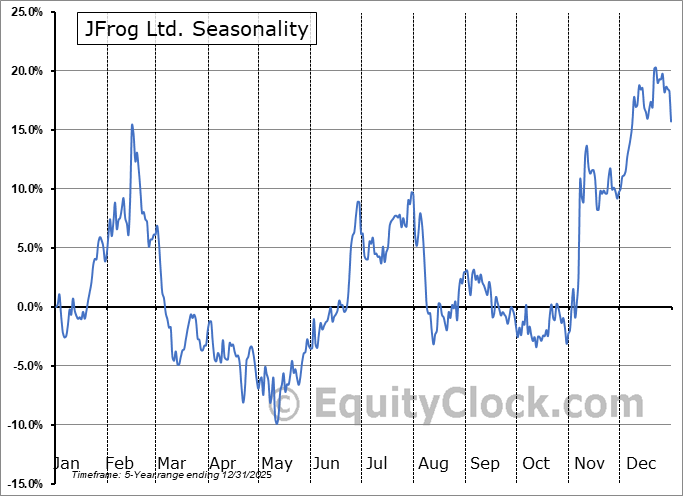
JFrog Ltd. (NASD:FROG) Seasonal Chart
Disclaimer: Comments and opinions offered in this report are for information only. They should not be considered as advice to purchase or to sell mentioned securities. Data offered is believed to be accurate, but is not guaranteed.
The Markets
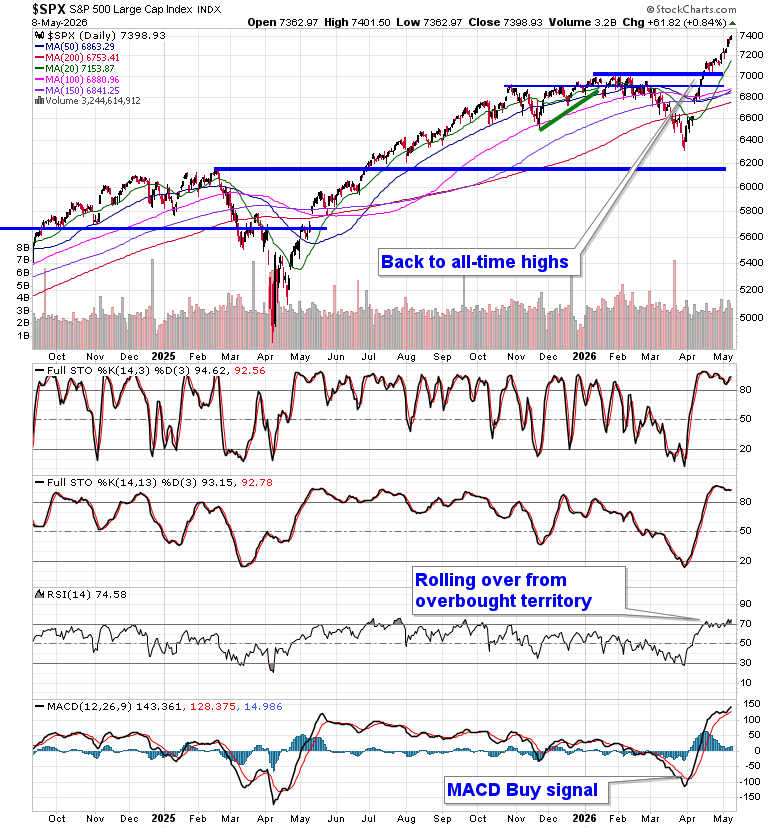
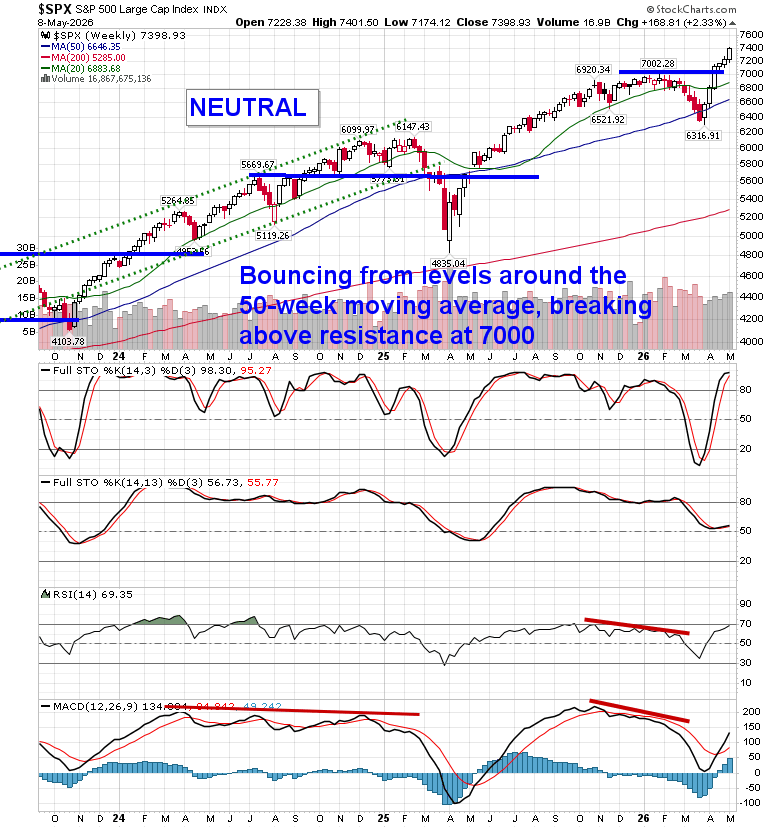
Markets continue to look beyond Iran uncertainty and pushed further into the technology sector on Friday, elevating the S&P 500 Index to another record high. The S&P 500 Index gained just over eight-tenths of one percent, remaining above the upside gap between 7270 and 7300 that was charted on Wednesday. The gaps beneath the market, looked to as levels of support, continue to accumulate, including the big one between 6620 and 6740, and, ultimately, the character of the market has changed where levels of resistance hold less weight than levels of support. As the market continues to move higher, so too do downside risks in the near-term, which can now be pegged towards levels around 7000 (the January highs). We are still playing with a positive side bias (albeit with hedges that have been added in recent weeks– see our April 22 Market Outlook). Momentum indicators continue to show signs of stall around overbought territory and there remains indication of upside exhaustion that could lend to a digestive phase on the horizon, particularly once we move beyond the height to earnings season. In the Seasonal Advantage Portfolio (which is strongly higher YTD, continuing to set new high watermarks) that we manage for clients at CastleMoore, we continue to be fully exposed to risk (stocks) after flipping from our low volatility stance around the end of March and our performance has been excellent (strongly outperforming the S&P 500 Index, Nasdaq Composite, and TSX Composite). The conflict in Iran remains a wildcard (and we are skeptical of the suggestion of a return to normal that the market is seemingly pricing in), but we have cues that we are following that would warrant abandoning our risk-on view and move towards a more defensive posture in risk assets. Subscribers can view the themes in our chart books to either Accumulate or Avoid that we continue to gear portfolios towards.

Today, in our Market Outlook to subscribers, we discuss the following:
- Weekly look at the large-cap benchmark
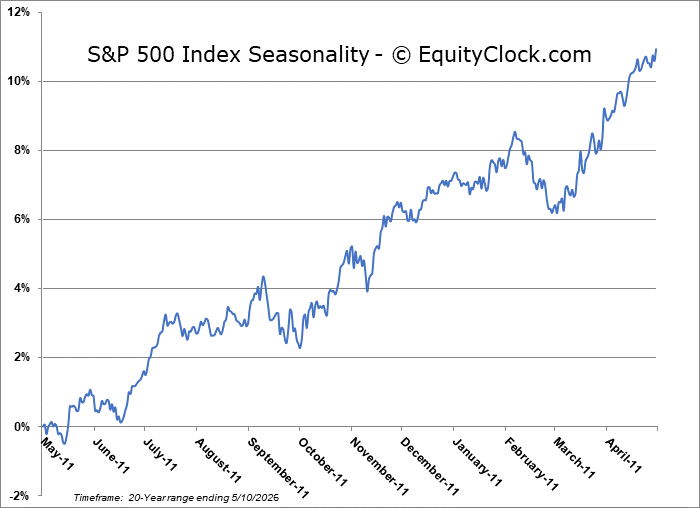
- The mid-May digestion of equity market strength
- US Nonfarm Payrolls and the investment implications within: What areas of the economy are strong or weak and how to position portfolios
- Canada Labour Force Survey
Subscribers can look for this report in their inbox or by clicking on the following link and logging in: Market Outlook for May 11
Not signed up yet? Subscribe now to receive full access to all of the research and analysis that we publish
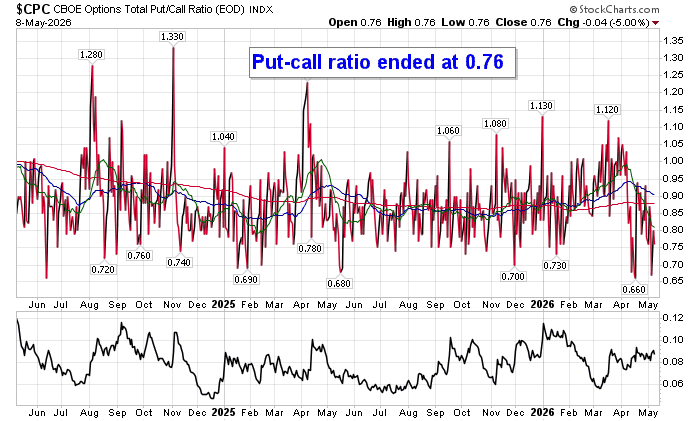
Sentiment on Friday, as gauged by the put-call ratio, ended bullish at 0.76.
Seasonal charts of companies reporting earnings today:


 Seasonal Chart")


S&P 500 Index
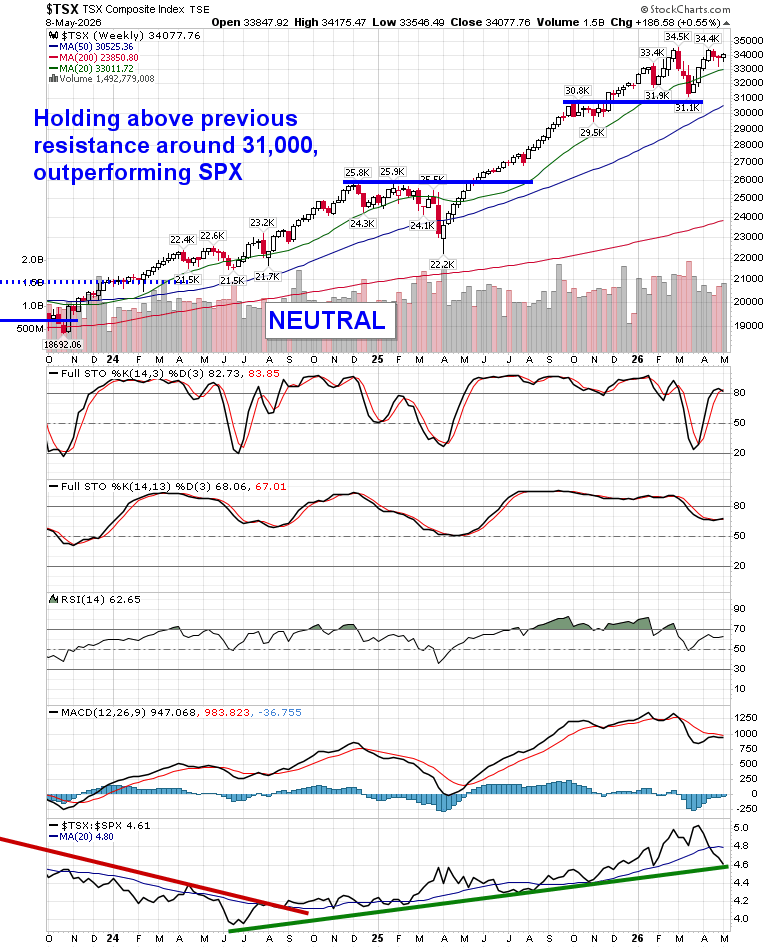
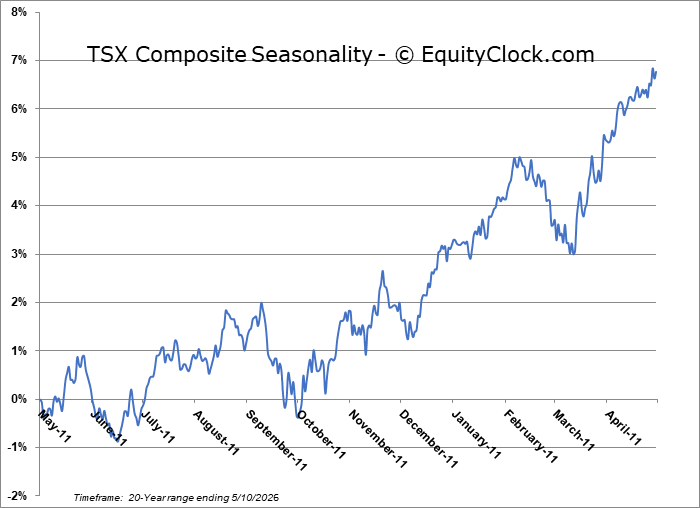
TSE Composite
| Sponsored By... |

|


