Stock Market Outlook for August 18, 2026

The entire AI trade is waking up again.
*** Stocks highlighted are for information purposes only and should not be considered as advice to purchase or to sell mentioned securities. As always, the use of technical and fundamental analysis is encouraged in order to fine tune entry and exit points to average seasonal trends.
Stocks Entering Period of Seasonal Strength Today:
Subscribers Click on the relevant link to view the full profile. Not a subscriber? Signup here.
Stock Highlight: |
|

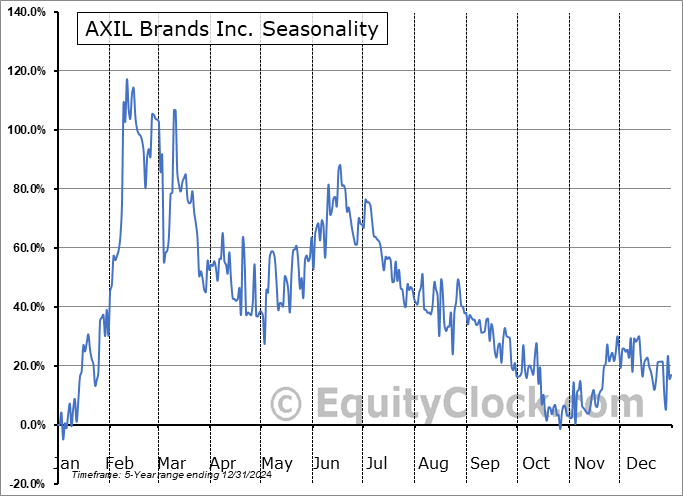
Keysight Technologies Inc. (NYSE:KEYS) Seasonal Chart |
|

Intel Corp. (NASD:INTC) Seasonal Chart

iShares China Index ETF (TSE:XCH.TO) Seasonal Chart

Preformed Line Products Co. (NASD:PLPC) Seasonal Chart

BMO MSCI All Country World High Quality Index ETF (TSE:ZGQ.TO) Seasonal Chart
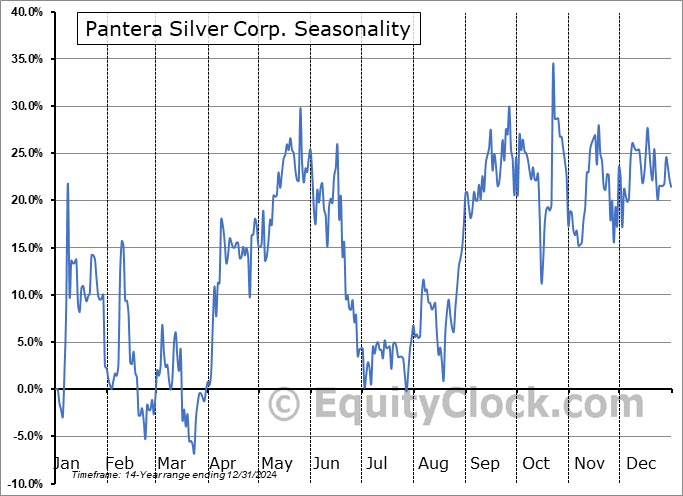
Pantera Silver Corp. (TSXV:PNTR.V) Seasonal Chart
Disclaimer: Comments and opinions offered in this report are for information only. They should not be considered as advice to purchase or to sell mentioned securities. Data offered is believed to be accurate, but is not guaranteed.
The Markets
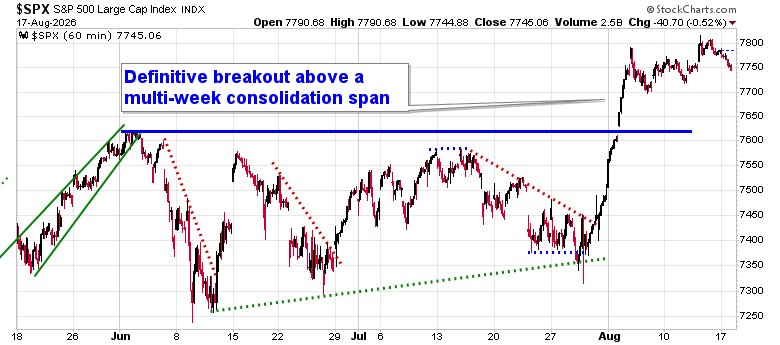
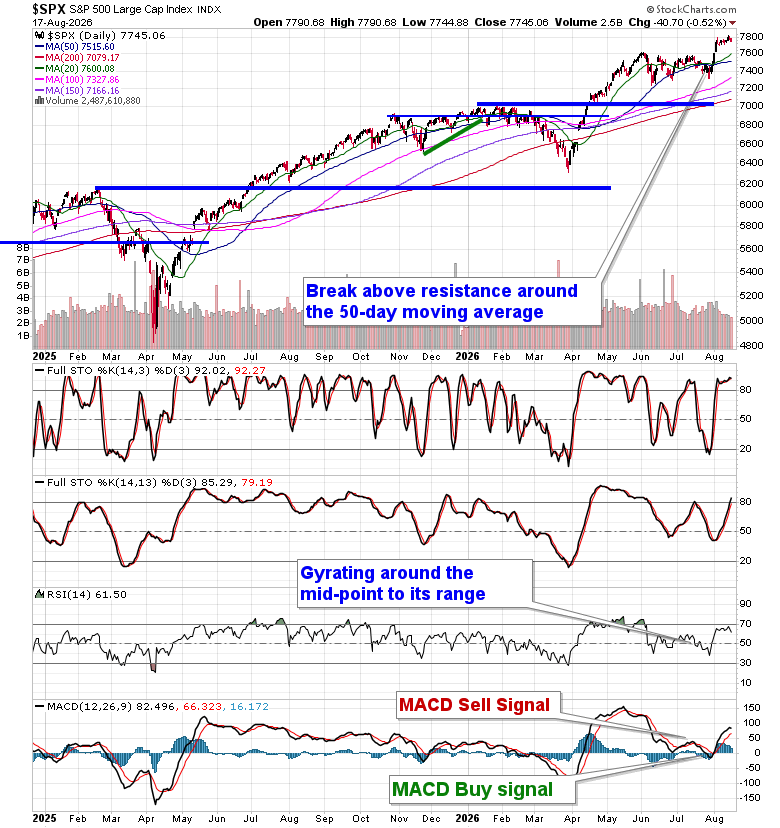
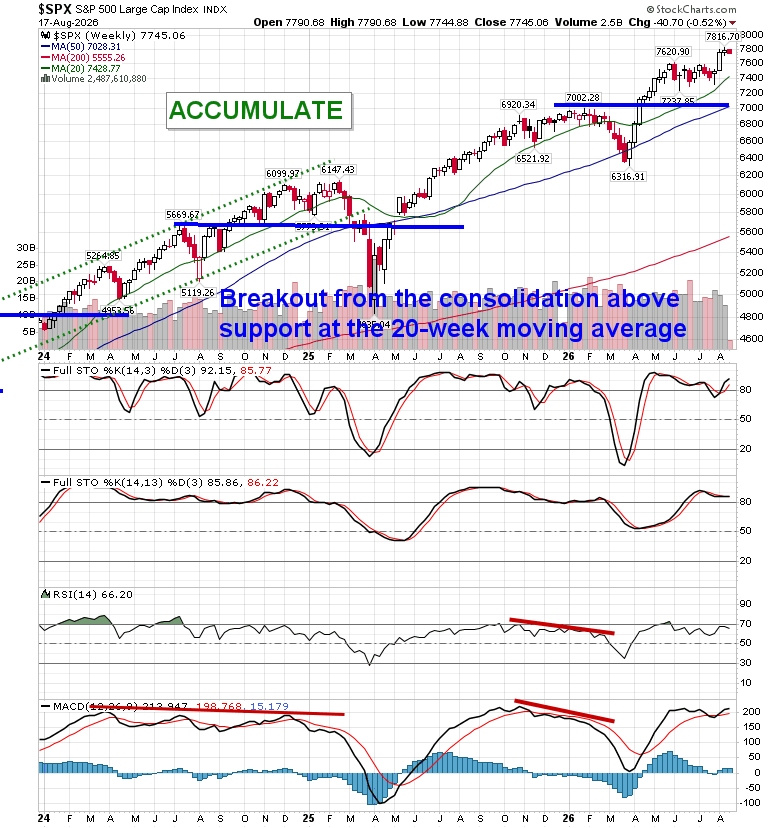
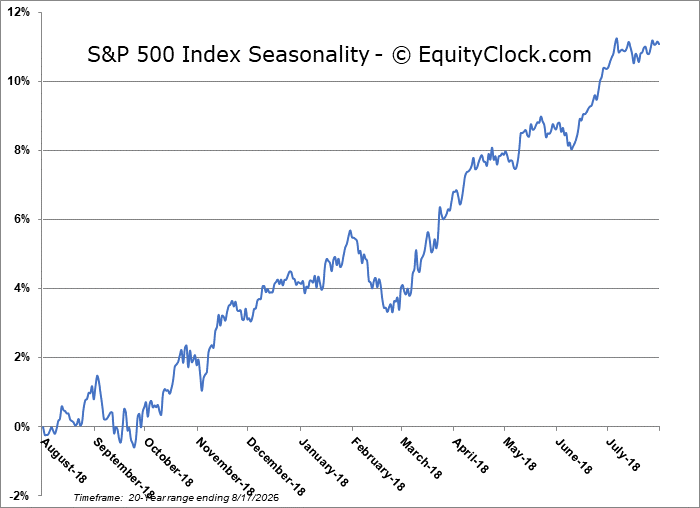
Further strength in the price of oil and the cost of borrowing (interest rates) kept the equity market capped during the Monday session. The S&P 500 Index slipped by just over half of one percent, continuing to hold above the consolidation span that the benchmark had been within since the start of June between 7250 and 7620; previous resistance at this upper threshold now turns into support. A short-term bull-flag pattern continues to be charted, suggesting further upside to be expected, although it may follow some kind of retracement towards aforementioned previous resistance at 7620. The benchmark remains above 20 and 50-day moving averages (~7515), keeping the ball in the bulls court heading through the middle of August. Daily momentum indicators remain on an upswing, moving above the declining path that had been charted since the end of May. The technicals are providing all of the characteristics to be bullish of stocks. In the Seasonal Advantage Portfolio that we manage for clients at CastleMoore, we never made any changes in our allocations during the abnormal July weakness. Following a first half performance in the Seasonal Advantage Portfolio that was well ahead of our own benchmark (as well as all major equity benchmarks in the market), we have had a view to expect strength for the start of the second half of the year, aligning with the optimism that the manufacturing economy is expressing. Our stance is now paying off. Earnings season has provided the cover to the headline threats in the market and, ultimately, the positive intermediate-term trajectory of the market persists. Subscribers can view what we are targeting in our list of market segments to either Accumulate or Avoid.
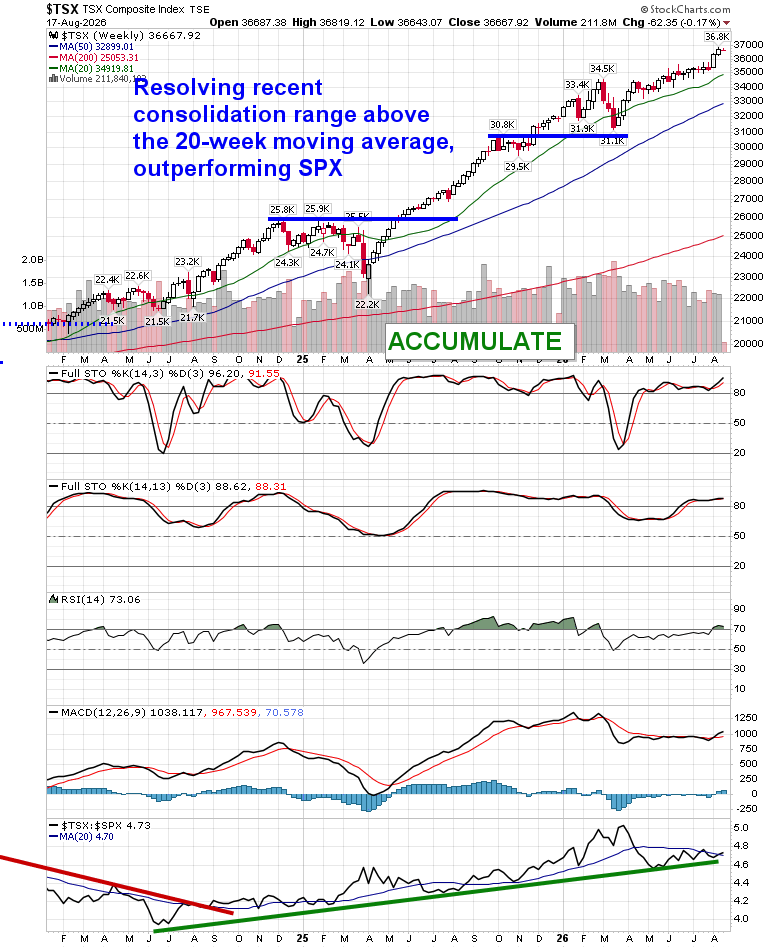
Want to know which areas of the market to buy or sell? Our Weekly Chart Books have just been updated, providing a clear Accumulate, Avoid, or Neutral rating for currencies, cryptocurrencies, commodities, broad markets, and subsectors/industries of the market. Subscribers can login and click on the relevant links to access.
- Currencies
- Cryptocurrencies
- Commodities
- Major Benchmarks
- Sub-sectors / Industries
- ETFs: Bonds | Commodities | Equity Markets | Industries | Sectors
Today, in our Market Outlook to subscribers, we discuss the following:
- Our weekly chart books update, along with our list of all segments of the market to either Accumulate or Avoid
- Other Notes
Subscribers can look for this report in their inbox or by clicking on the following link and logging in: Market Outlook for August 18
Not signed up yet? Subscribe now to receive full access to all of the research and analysis that we publish
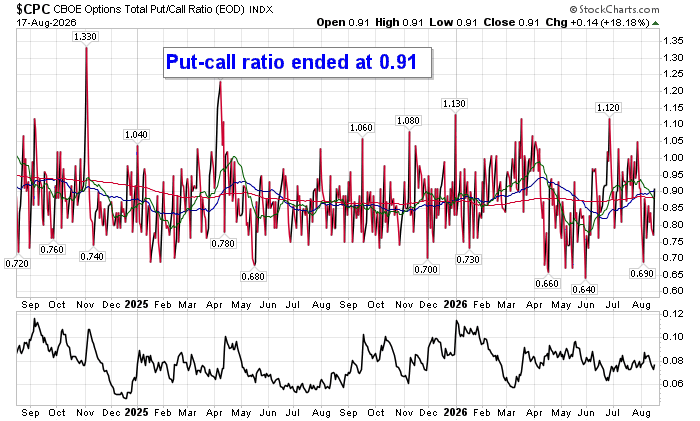
Sentiment on Monday, as gauged by the put-call ratio, ended bullish at 0.91.
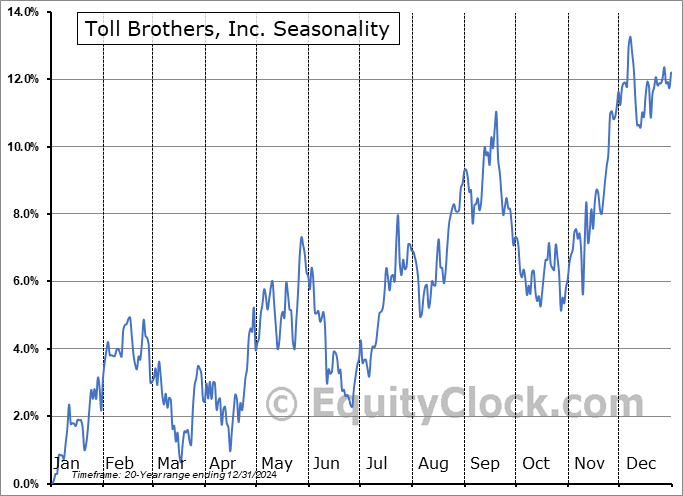
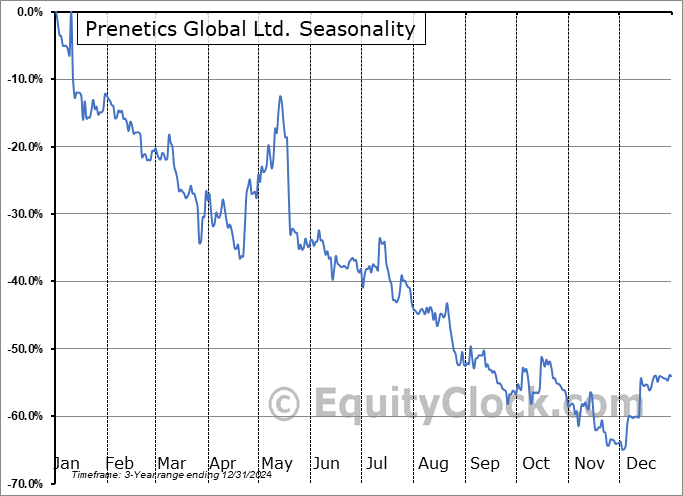
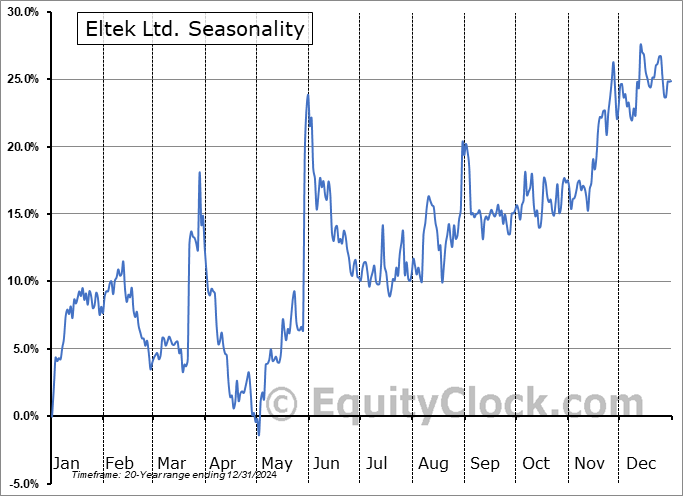
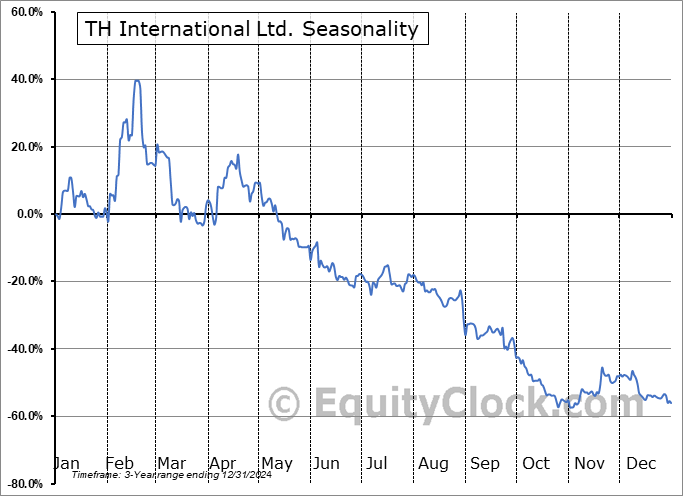
Seasonal charts of companies reporting earnings today:






S&P 500 Index
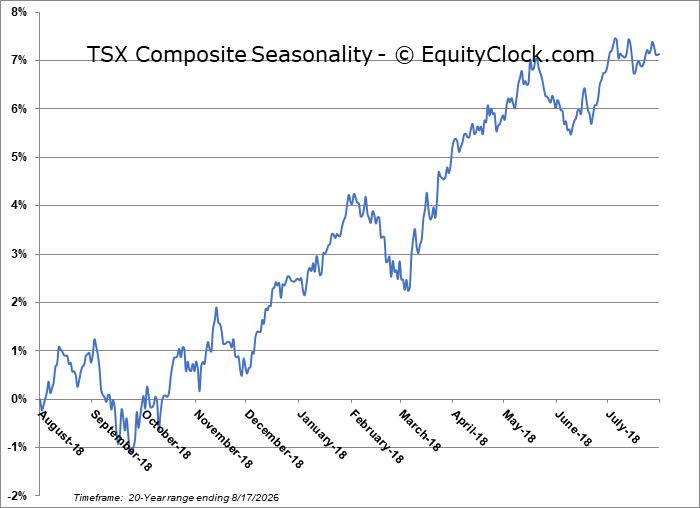
TSE Composite
| Sponsored By... |

|


