Stock Market Outlook for November 16, 2026

Backdrop remains unfavourable to become aggressive in broad risk exposure at this time. We’ll tell you what we’re steering our portfolios towards.
*** Stocks highlighted are for information purposes only and should not be considered as advice to purchase or to sell mentioned securities. As always, the use of technical and fundamental analysis is encouraged in order to fine tune entry and exit points to average seasonal trends.
Stocks Entering Period of Seasonal Strength Today:
Subscribers Click on the relevant link to view the full profile. Not a subscriber? Signup here.
Stock Highlight: |
|

Altria Group Inc. (NYSE:MO) Seasonal Chart |
|

CGI Group, Inc. (TSE:GIB/A.TO) Seasonal Chart

Illumina, Inc. (NASD:ILMN) Seasonal Chart

Abbott Laboratories (NYSE:ABT) Seasonal Chart

Enbridge, Inc. (TSE:ENB.TO) Seasonal Chart

CNH Industrial NV (NYSE:CNH) Seasonal Chart

Advanced Micro Devices, Inc. (NASD:AMD) Seasonal Chart

Fairfax Financial Holdings Ltd. (TSE:FFH.TO) Seasonal Chart

Interfor Corp. (TSE:IFP.TO) Seasonal Chart
Disclaimer: Comments and opinions offered in this report are for information only. They should not be considered as advice to purchase or to sell mentioned securities. Data offered is believed to be accurate, but is not guaranteed.
The Markets
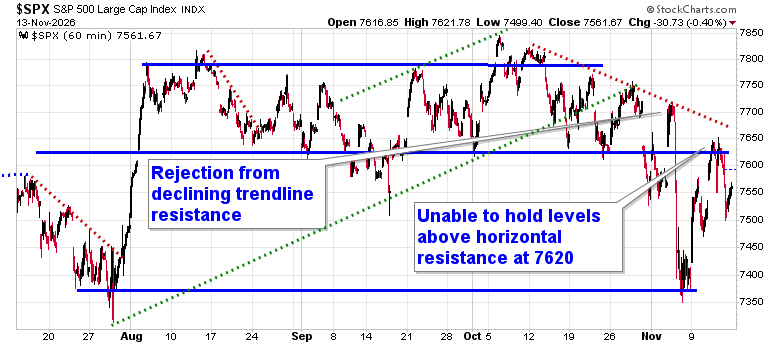
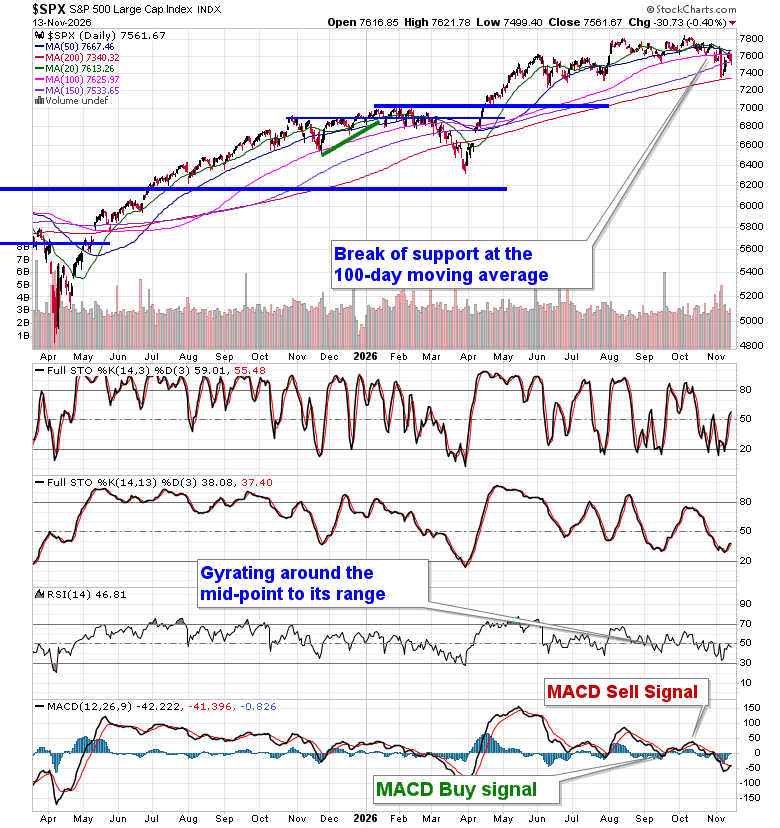
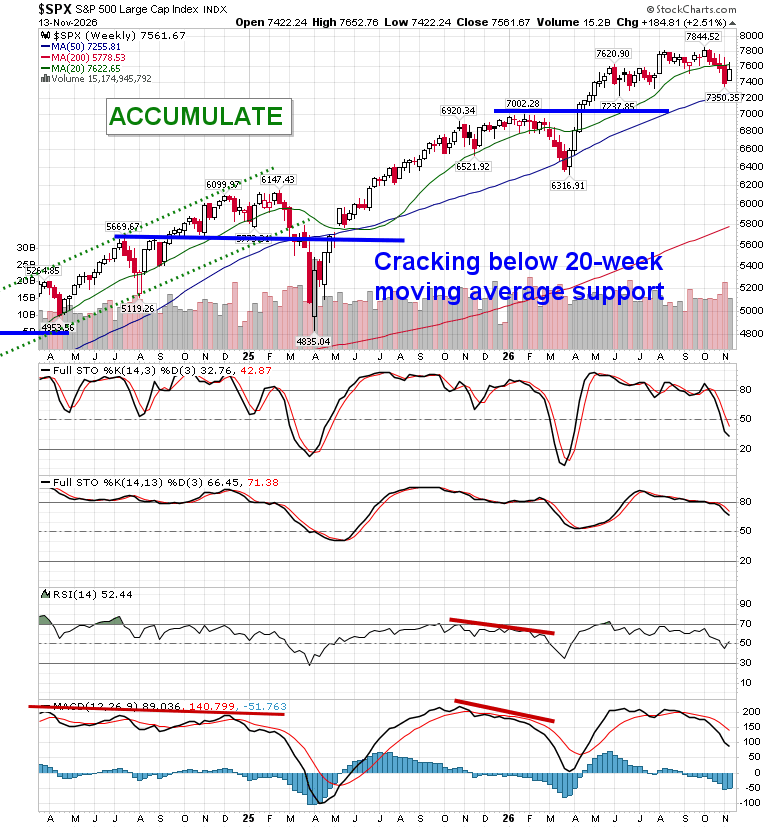
Stocks slipped to end the week as scrutiny surrounding the AI buildout remains high amidst the shakeup/turmoil at NVIDIA (NVDA); a jump in interest rates and the dollar certainly did not help. The S&P 500 Index fell by four-tenths of one percent, continuing to roll over below short-term declining trendline resistance that we have been highlighting for the past month; the ultra-short-term trend of lower-highs and lower-lows remains intact. Healing on the charts is going to entail a conclusion to this declining path that has burdened the market benchmark since the start of October. The index remains within the cloud of major moving averages and the 200-day moving average is last line in the sand on the downside (although we would prefer to reference the 50-week moving average – 7255). As noted in our recent chart books, there are segments following recent price action that we haven’t wanted to be exposed to, including Semiconductor and various technology industries, but the market has provided rotation opportunities that allowed us to maintain our overall equity exposure. Members can stay on top of our thinking and what we are watching in our regular reports, as well as view what we are targeting in our list of market segments to either Accumulate or Avoid
Today, in our Market Outlook to subscribers, we discuss the following:
- Weekly look at the large-cap benchmark
- Producer Prices and the investment implications from the hot inflationary backdrop
- The pronounced downfall in the bond market last week
- The seasonal trade in Natural Gas
- Additional Thoughts (Canada Manufacturing Sales, Volatility Index, Health Care, Consumer Discretionary)
Subscribers can look for this report in their inbox or by clicking on the following link and logging in: Market Outlook for November 16
Not signed up yet? Subscribe now to receive full access to all of the research and analysis that we publish
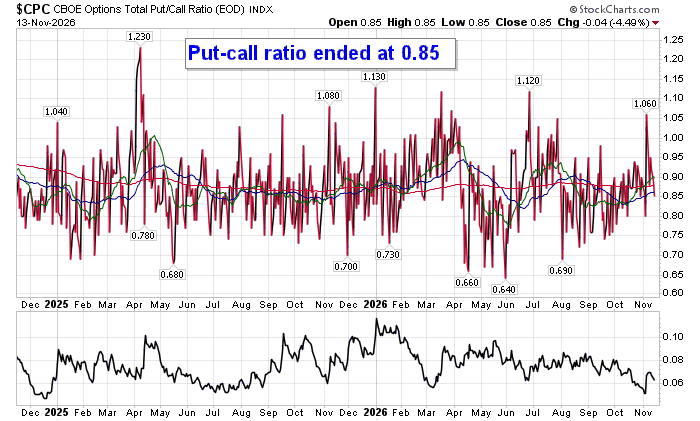
Sentiment on Friday, as gauged by the put-call ratio, ended bullish at 0.85.
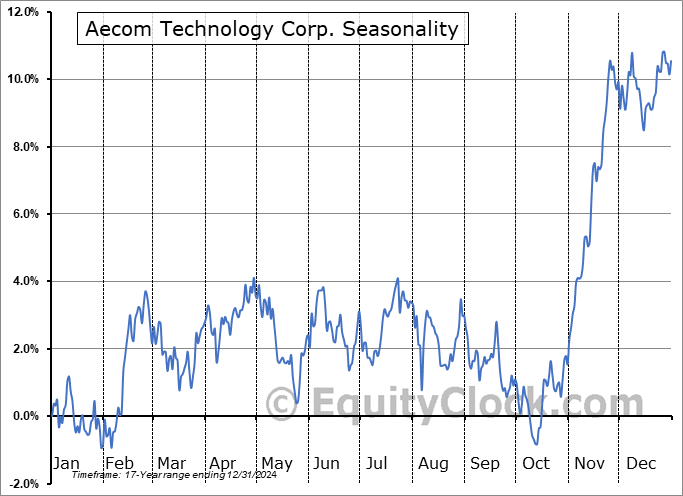
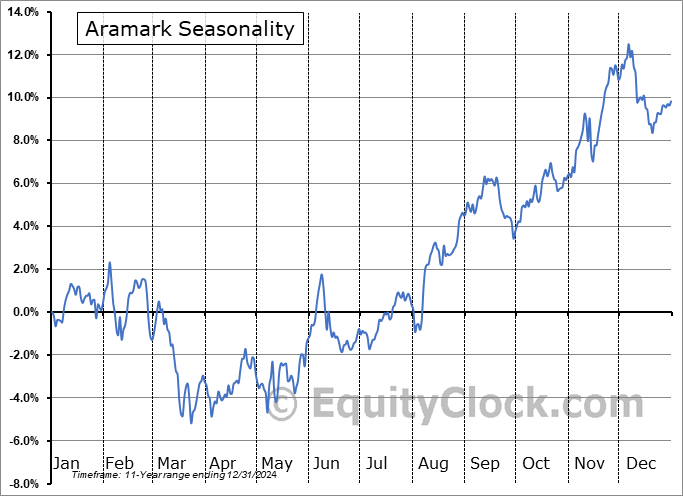
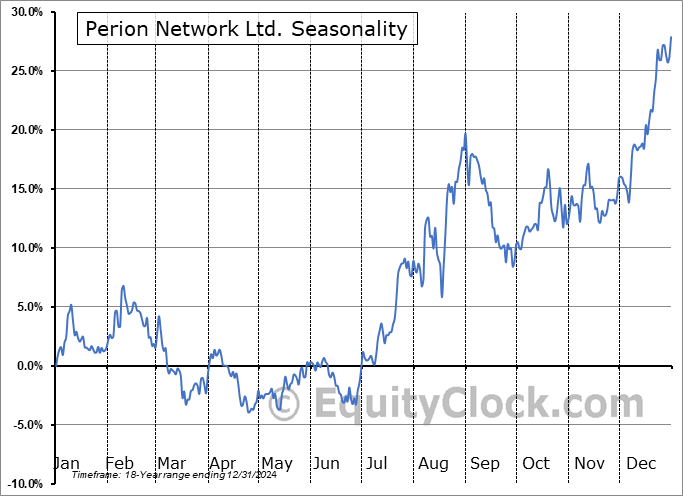
Seasonal charts of companies reporting earnings today:








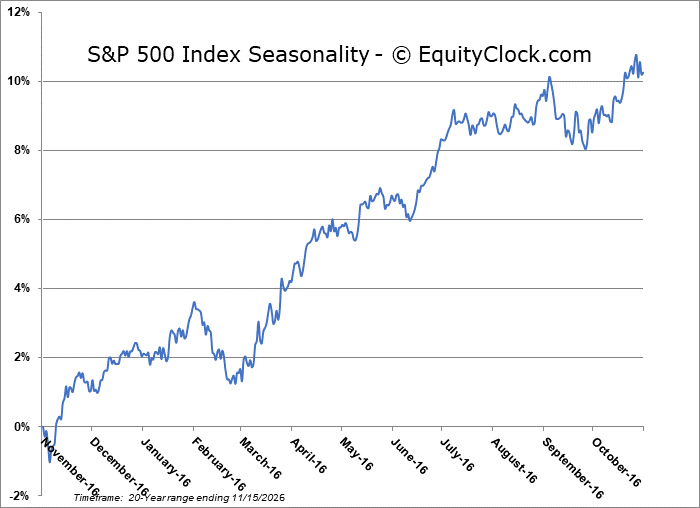
S&P 500 Index
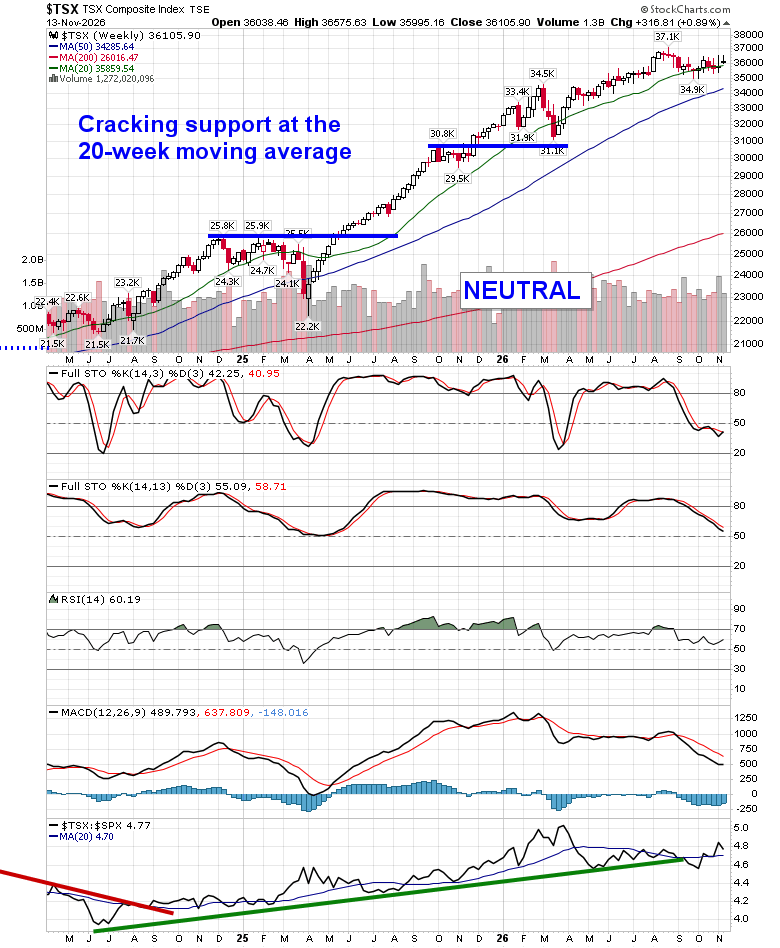
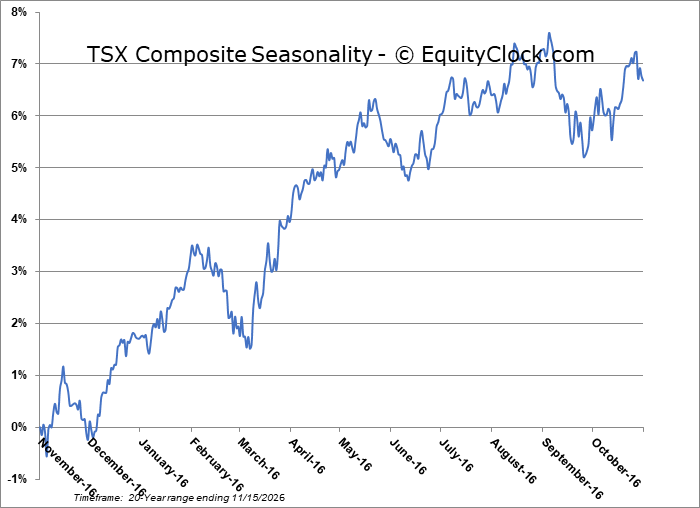
TSE Composite
| Sponsored By... |

|


