Stock Market Outlook for November 13, 2026

Running down some of the key coincident indicators of economic health (and the stability of the equity market).
*** Stocks highlighted are for information purposes only and should not be considered as advice to purchase or to sell mentioned securities. As always, the use of technical and fundamental analysis is encouraged in order to fine tune entry and exit points to average seasonal trends.
Stocks Entering Period of Seasonal Strength Today:
Subscribers Click on the relevant link to view the full profile. Not a subscriber? Signup here.

Hess Midstream Partners LP (NYSE:HESM) Seasonal Chart

Howmet Aerospace Inc. (NYSE:HWM) Seasonal Chart

Arrow Electronics Inc. (NYSE:ARW) Seasonal Chart

Canadian Utilities Ltd. (TSE:CU.TO) Seasonal Chart

Saputo Group, Inc. (TSE:SAP.TO) Seasonal Chart

iShares Russell Mid-Cap Value ETF (NYSE:IWS) Seasonal Chart
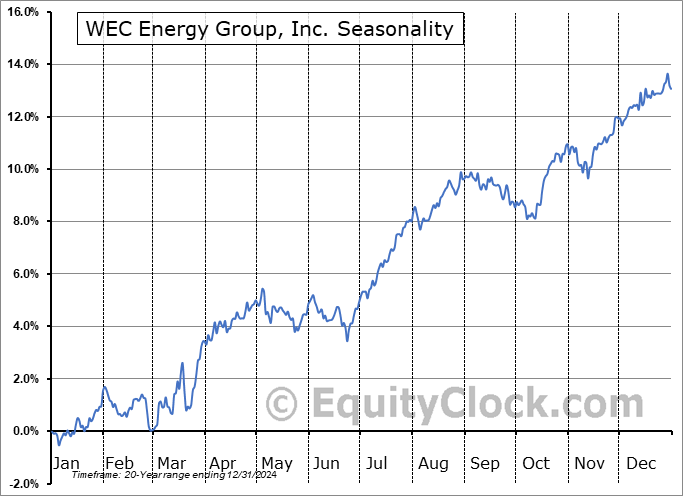
WEC Energy Group, Inc. (NYSE:WEC) Seasonal Chart

Invesco MSCI Global Timber ETF (NYSE:CUT) Seasonal Chart
Disclaimer: Comments and opinions offered in this report are for information only. They should not be considered as advice to purchase or to sell mentioned securities. Data offered is believed to be accurate, but is not guaranteed.
The Markets
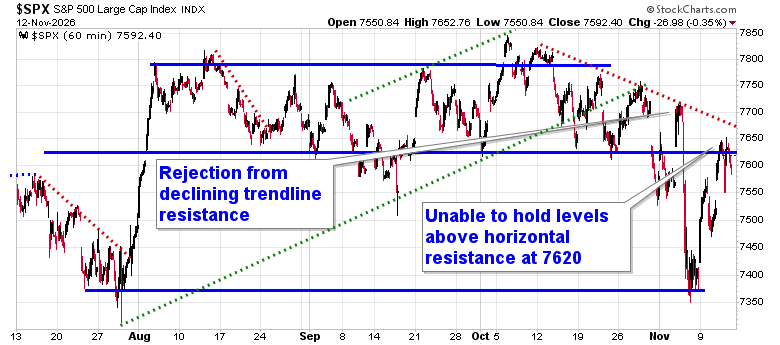
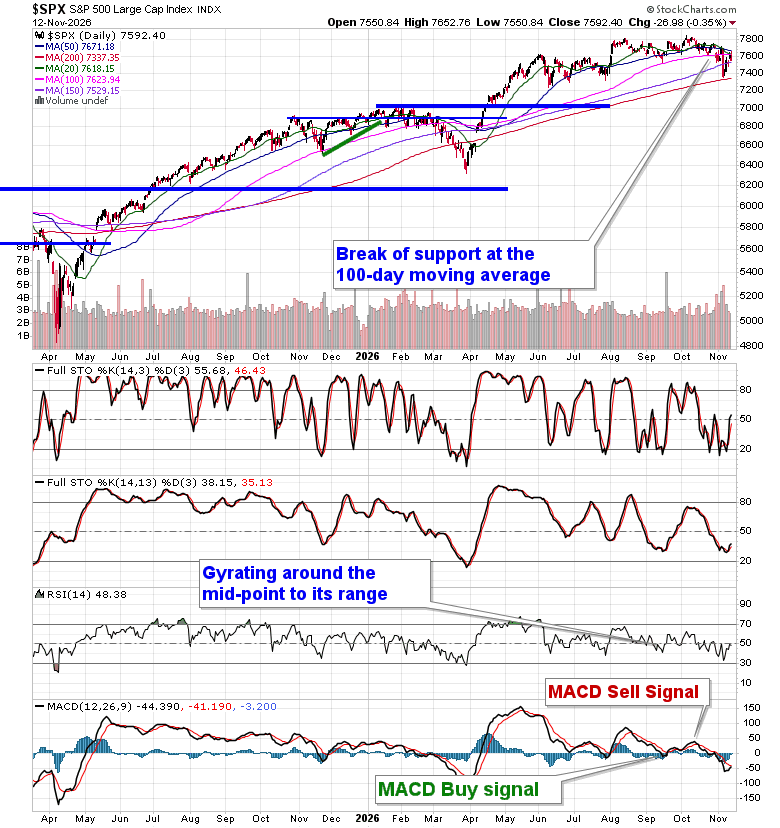
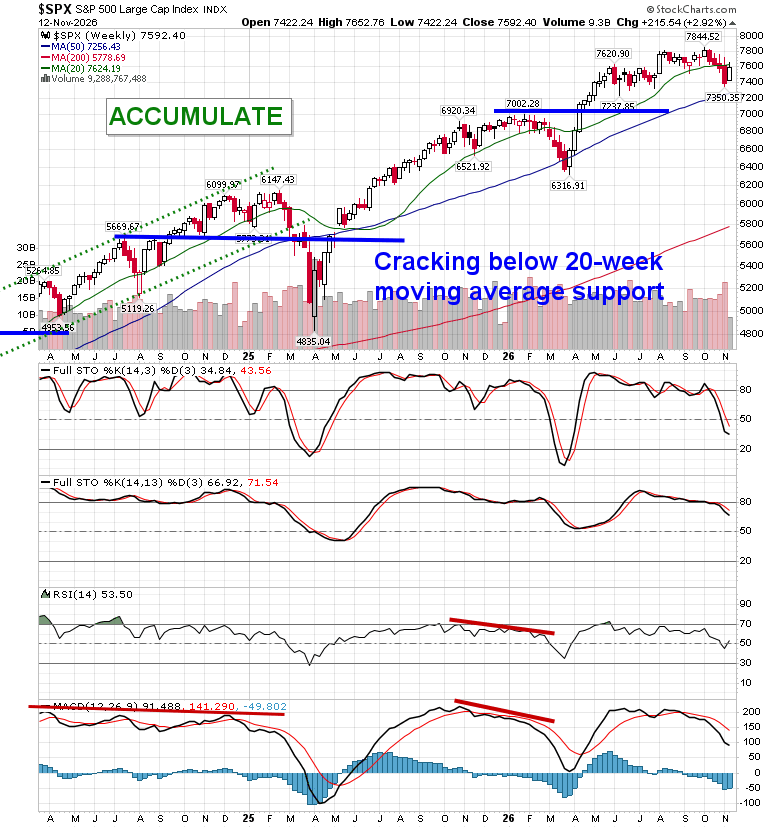
Stocks slipped on Thursday as a shakeup at NVIDIA had traders trimming risk following the powerful rebound in technology stocks this week. The S&P 500 Index ended lower by just over a third of one percent, rolling over below declining trendline resistance that we have been highlighting for the past month, keeping the ultra-short-term trend of lower-highs and lower-lows intact. Healing on the charts is going to entail a conclusion to this declining path that has burdened the market benchmark since the start of October. The index remains within the cloud of major moving averages and the 200-day moving average is last line in the sand on the downside (although we would prefer to reference the 50-week moving average – 7255). As noted in our recent chart books, there are segments following recent price action that we haven’t wanted to be exposed to, including Semiconductor and various technology industries, but the market has provided rotation opportunities that allowed us to maintain our overall equity exposure. Members can stay on top of our thinking and what we are watching in our regular reports, as well as view what we are targeting in our list of market segments to either Accumulate or Avoid
Today, in our Market Outlook to subscribers, we discuss the following:
- Scrutinizing the QQQ ETF following NVIDIA’s fallout
- US Existing Home Sales, the change in the median price of homes, and the strong rise in inventories; what it means for the housing market, consumer, and economy.
- Weekly Jobless Claims and the health of the labor market
- The change in gasoline demand
- Energy sector stocks and the one segment in this space that remains enticing
- Additional Thoughts (Bitcoin, US Dollar, Volatility Index)
Subscribers can look for this report in their inbox or by clicking on the following link and logging in: Market Outlook for November 13
Not signed up yet? Subscribe now to receive full access to all of the research and analysis that we publish
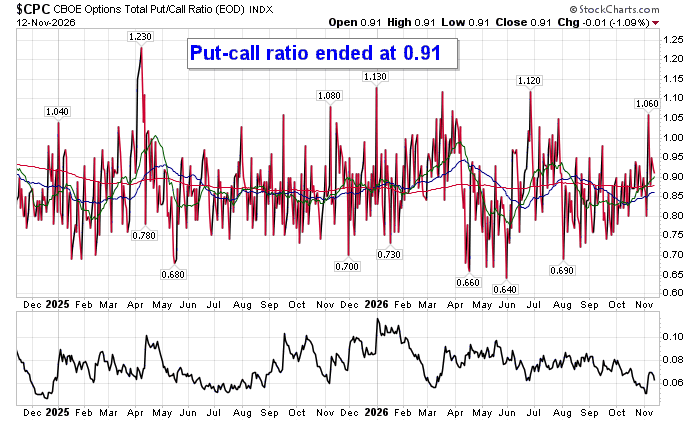
Sentiment on Thursday, as gauged by the put-call ratio, ended bullish at 0.91.
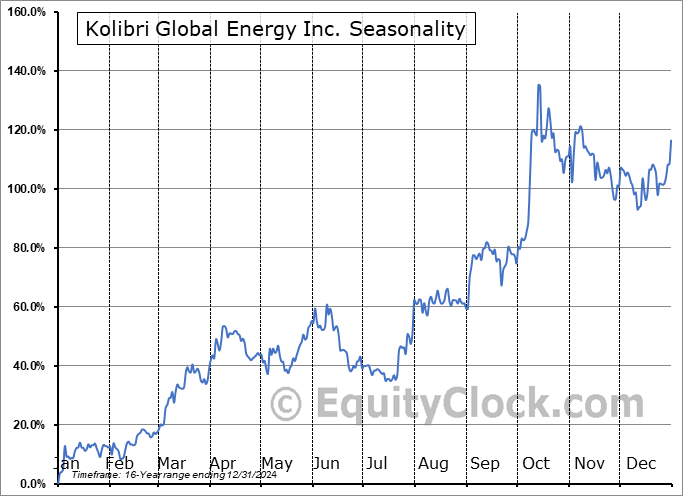
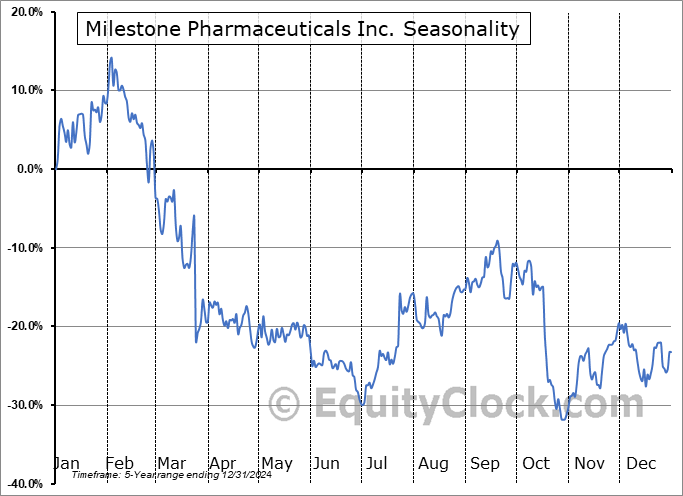
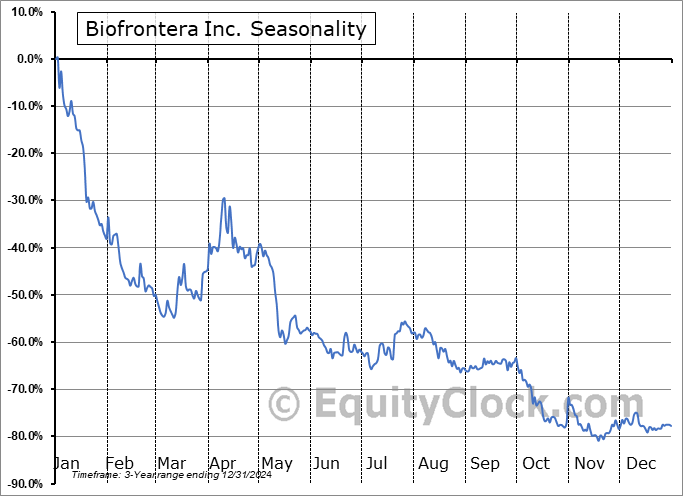
Seasonal charts of companies reporting earnings today:








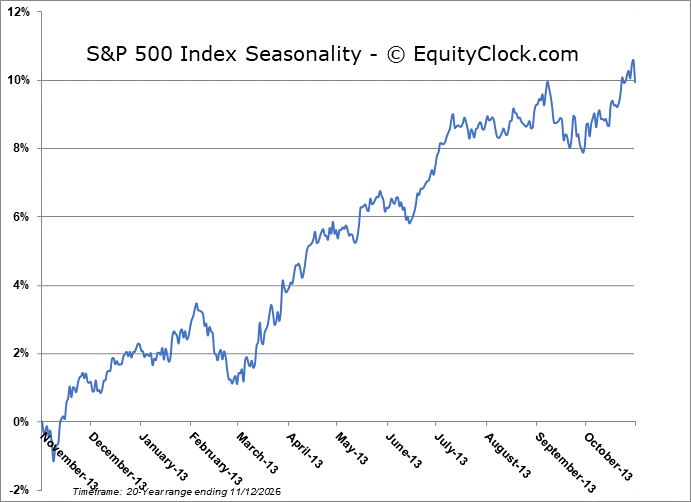
S&P 500 Index
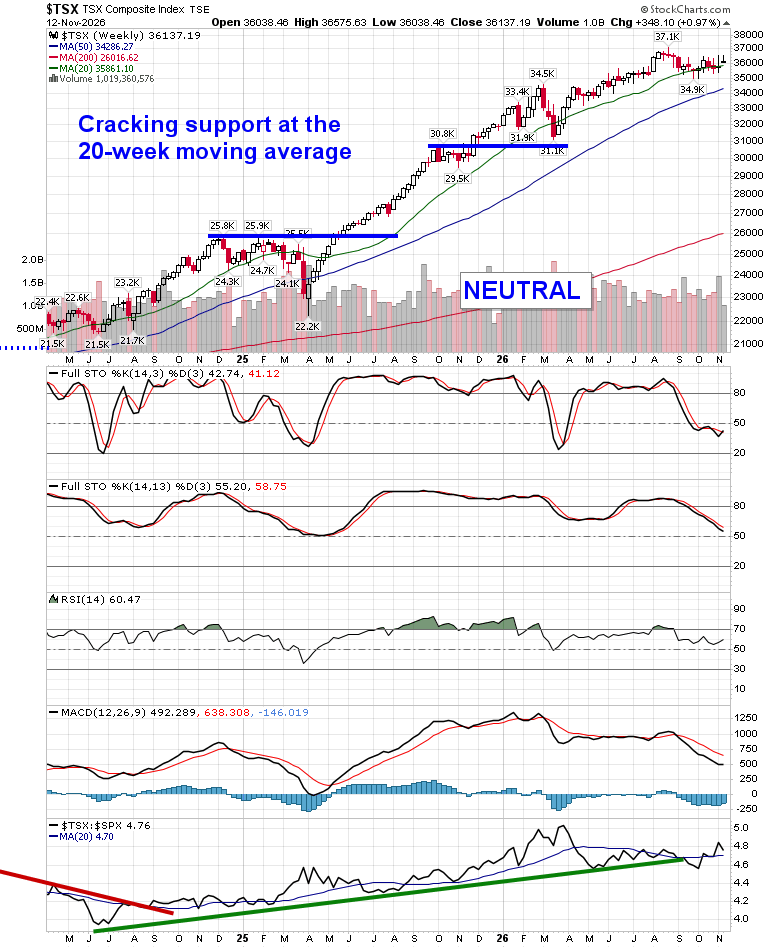
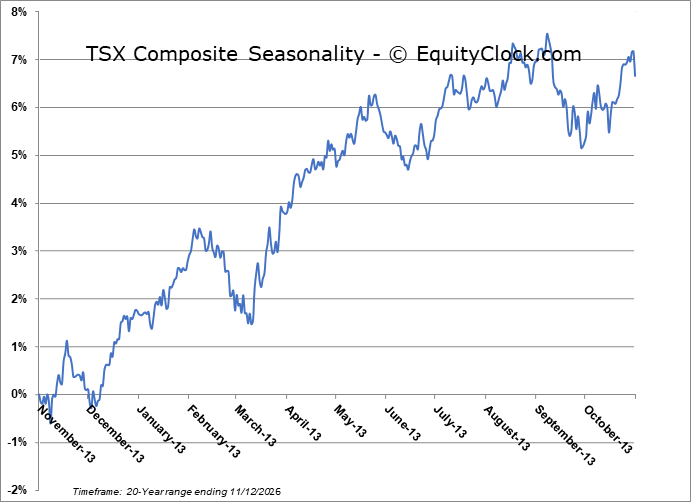
TSE Composite
| Sponsored By... |

|


