Stock Market Outlook for October 6, 2026

Major equity benchmarks testing all-time highs, but breadth remains poor, setting up for what could be a volatile mid-October period for stocks.
*** Stocks highlighted are for information purposes only and should not be considered as advice to purchase or to sell mentioned securities. As always, the use of technical and fundamental analysis is encouraged in order to fine tune entry and exit points to average seasonal trends.
Stocks Entering Period of Seasonal Strength Today:
Subscribers Click on the relevant link to view the full profile. Not a subscriber? Signup here.
Stock Highlight: |
|

New Pacific Metals Corp. (TSE:NUAG.TO) Seasonal Chart |
|

Invesco S&P 100 Equal Weight ETF (AMEX:EQWL) Seasonal Chart

AtriCure Inc. (NASD:ATRC) Seasonal Chart
Disclaimer: Comments and opinions offered in this report are for information only. They should not be considered as advice to purchase or to sell mentioned securities. Data offered is believed to be accurate, but is not guaranteed.
The Markets
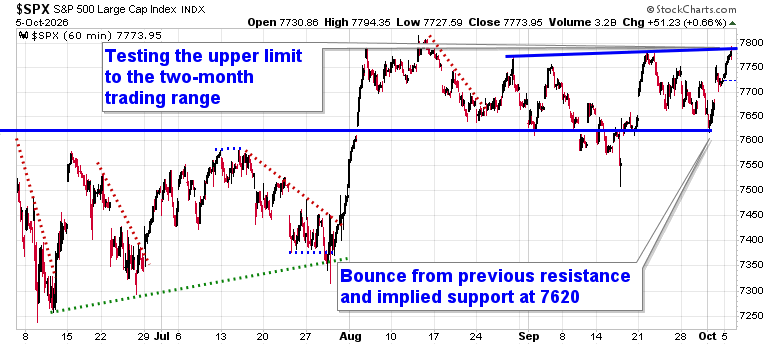
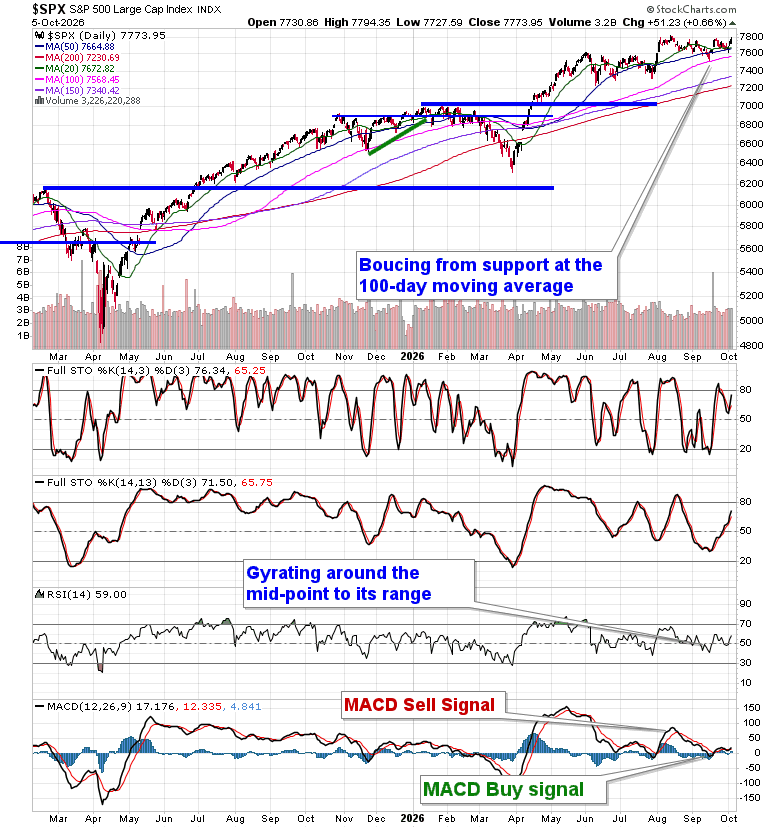
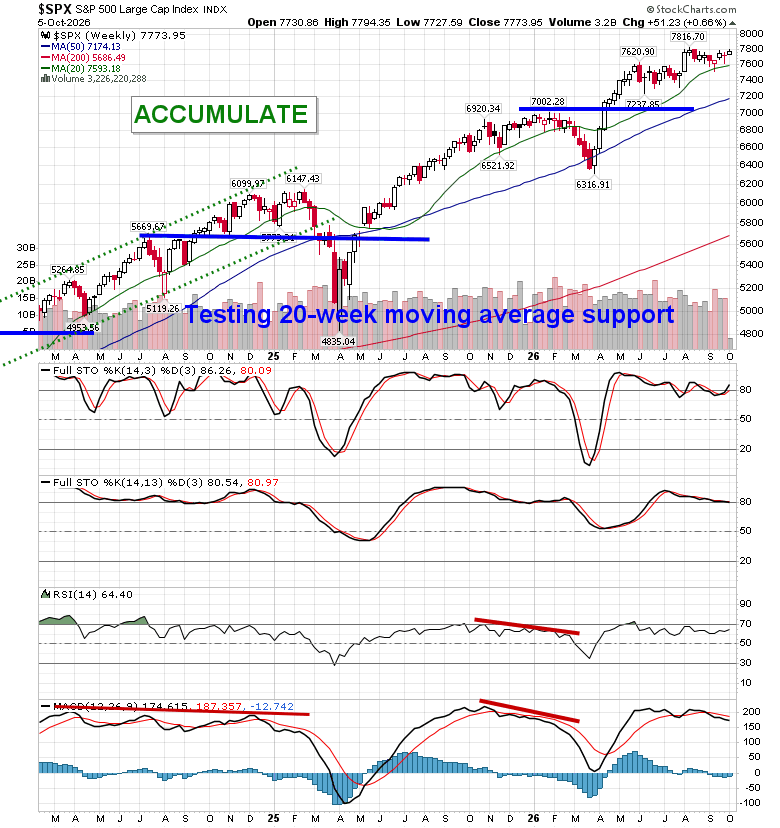
Stocks pushed higher on Monday as a wobble in interest rates around multi-decade highs gave traders confidence that the cost of borrowing may be peaking in the near-term. The S&P 500 Index added two-thirds of one percent, trading to the upper limit of the range that the benchmark has been in since August between 7620 and 7800. The upper bound forms the basis of the neckline to a head-and-shoulders pattern, a bullish setup that could see a resolution towards 8000. Following the mid-September bounce from the 100-day moving average (7568), recent days have seen as successful test of the 50-day moving average (7664), a testament to the support that these variable hurdles have been providing to the short and intermediate-term trends. While beyond what has historically been the weakest two-week stretch of the year at the end of September, volatility in the market tends to remain heightened into the month of October, therefore caution has been appropriate, but we have been pushing back against the negativity that is typical for this timeframe (see our September 18th report). We continue to examine what may be the appropriate stance in equity positioning for the month of October, but we did start to de-risk recently in our Super Simple Seasonal Portfolio (trimming our commodity/oil exposure). Subscribers can stay on top of our thinking and what we are watching in our regular reports, as well as view what we are targeting in our list of market segments to either Accumulate or Avoid.
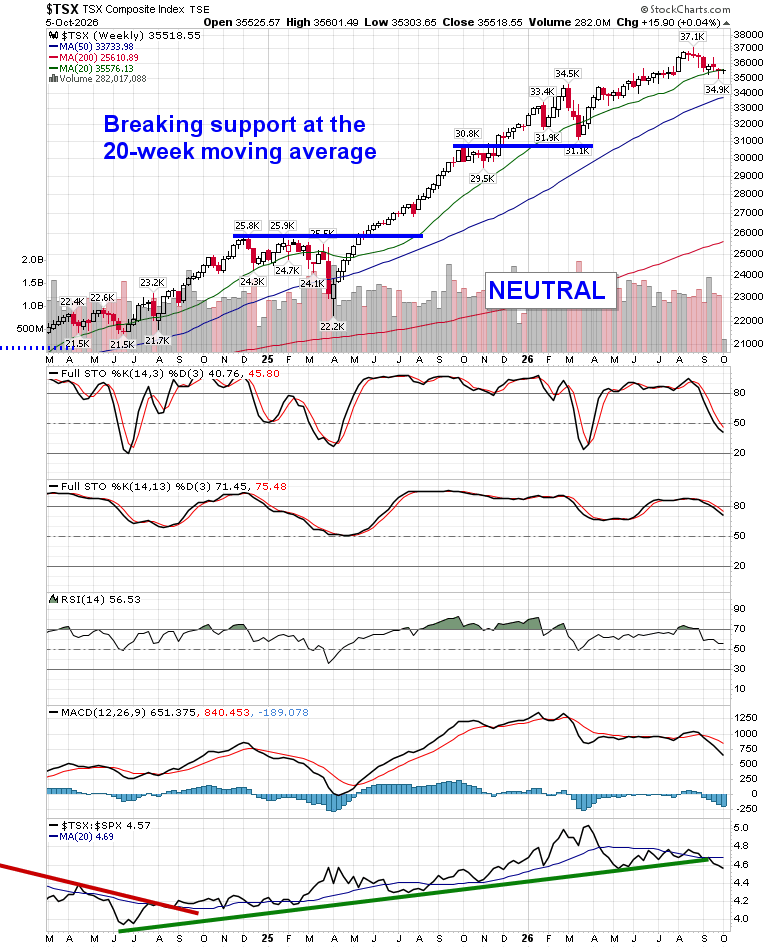
Want to know which areas of the market to buy or sell? Our Weekly Chart Books have just been updated, providing a clear Accumulate, Avoid, or Neutral rating for currencies, cryptocurrencies, commodities, broad markets, and subsectors/industries of the market. Subscribers can login and click on the relevant links to access.
- Currencies
- Cryptocurrencies
- Commodities
- Major Benchmarks
- Sub-sectors / Industries
- ETFs: Bonds | Commodities | Equity Markets | Industries | Sectors
Today, in our Market Outlook to subscribers, we discuss the following:
- Our weekly chart books update, along with our list of all segments of the market to either Accumulate or Avoid
- Other Notes
Subscribers can look for this report in their inbox or by clicking on the following link and logging in: Market Outlook for October 6
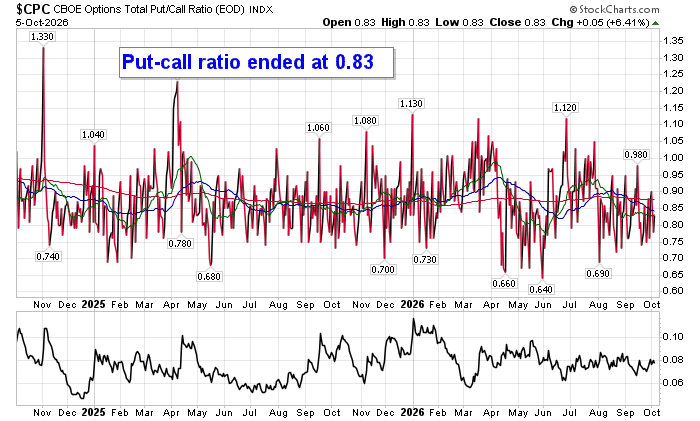
Sentiment on Monday, as gauged by the put-call ratio, ended bullish at 0.83.
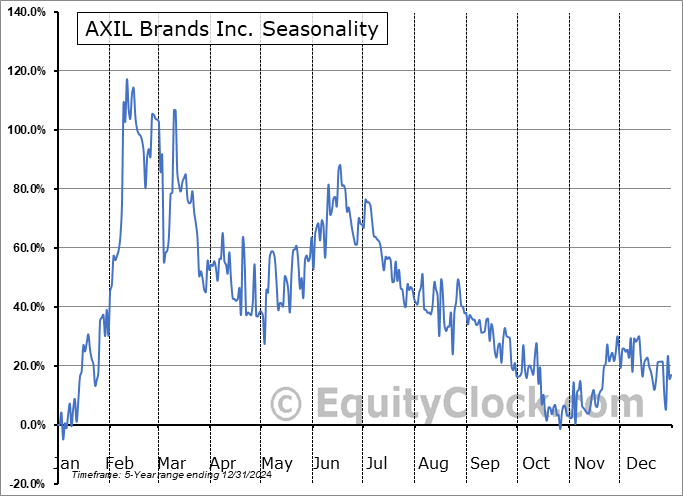
Seasonal charts of companies reporting earnings today:




S&P 500 Index

TSE Composite
| Sponsored By... |

|


