Stock Market Outlook for November 23, 2026

Headwinds that suggested caution in risk assets are fading, while the cues that signal significant market lows have been triggered.
*** Stocks highlighted are for information purposes only and should not be considered as advice to purchase or to sell mentioned securities. As always, the use of technical and fundamental analysis is encouraged in order to fine tune entry and exit points to average seasonal trends.
Stocks Entering Period of Seasonal Strength Today:
Subscribers Click on the relevant link to view the full profile. Not a subscriber? Signup here.

Stagwell Inc. (NASD:STGW) Seasonal Chart

Taiwan Fund, Inc. (NYSE:TWN) Seasonal Chart

James Hardie Industries NV (NYSE:JHX) Seasonal Chart

Estee Lauder Cos. (NYSE:EL) Seasonal Chart

AT&T, Inc. (NYSE:T) Seasonal Chart

Taiwan Semiconductor Mfg (NYSE:TSM) Seasonal Chart

Zimmer Biomet Holdings, Inc. (NYSE:ZBH) Seasonal Chart

ON Semiconductor Corp. (NASD:ON) Seasonal Chart

Talon Metals Corp. (TSE:TLO.TO) Seasonal Chart

Extra Space Storage Inc. (NYSE:EXR) Seasonal Chart
Disclaimer: Comments and opinions offered in this report are for information only. They should not be considered as advice to purchase or to sell mentioned securities. Data offered is believed to be accurate, but is not guaranteed.
The Markets
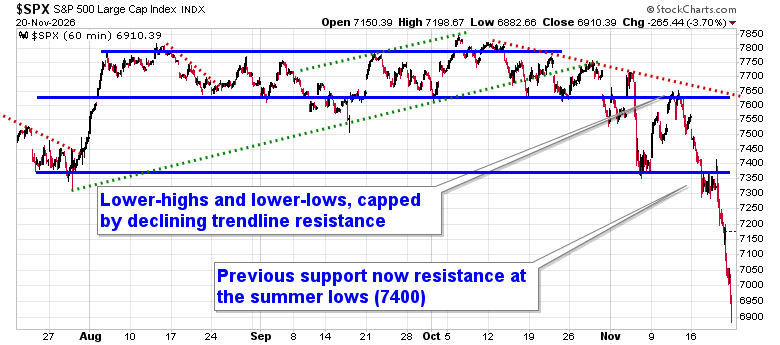
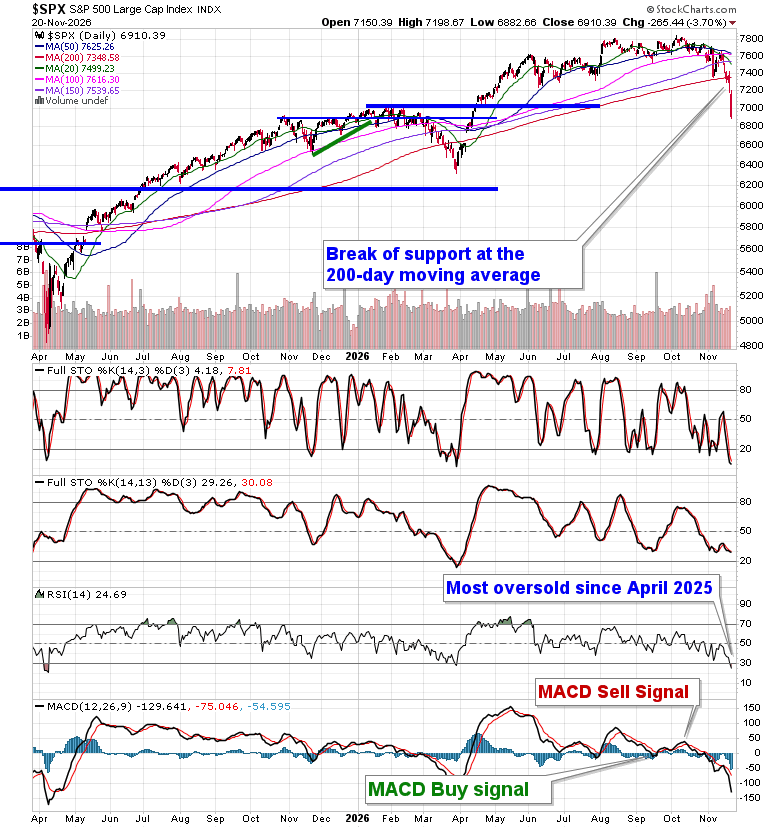
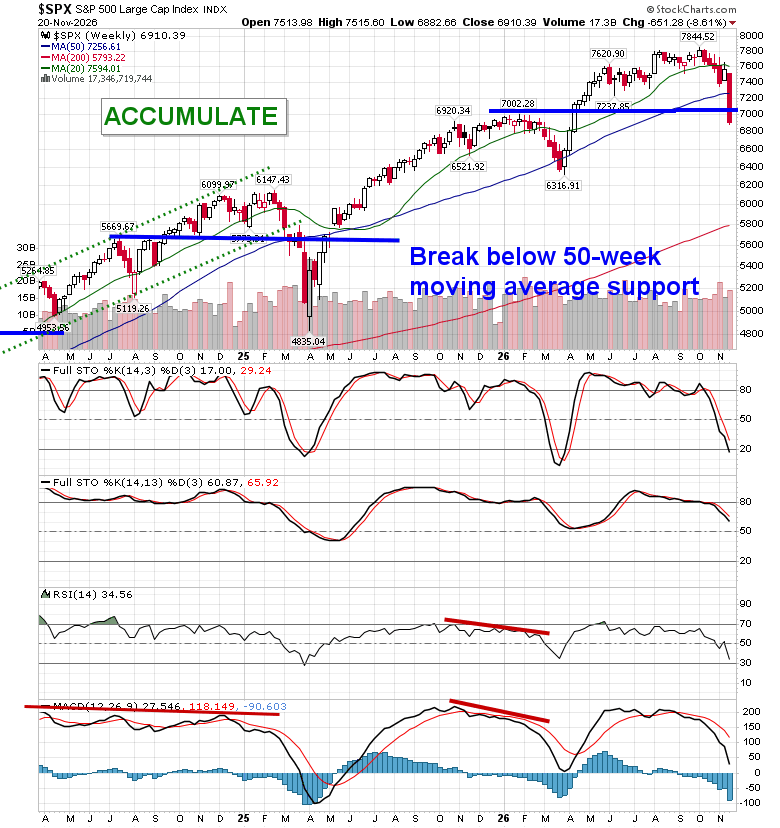
An ugly day for stocks as further panic in the Technology sector and the expiration of options fueled significant selling pressures in the market. The S&P 500 Index dropped by 3.70%, stretching what was a fairly orderly short-term declining trend into a parabolic correction. These stretched conditions are rarely sustained (without some catalyst), but as the damage on the charts continues to stack up, the healing process is going to take that much longer; the prevailing path is still that of lower-lows and lower-highs with resistance now defined at the summer lows around 7400. The daily chart shows that the market benchmark is now the most oversold since the April 2025 Liberation Day selloff with the relative strength index (RSI) below 30. The 200-day moving average has been broken, removing the cloud of major moving average that had supported the market previous, and the analysts are coming out with their saying that “nothing good happens below” the long-term moving average. The next level that traders can reference as support is the upside open gap that was charted around the start of April between 6618 and 6740, the zone that acted as the trigger for the technology-led euphoria this past spring. It is not important that the market fill this zone (although it has looked ripe for a gap fill for a long time), but it will be important for the broader market to retain this broader zone of support between 6500 and 7000, a massive span of supply if broken. The market has been swift to slice below levels of support and now is the time to confirm some of those previous hurdles as resistance between now and year-end. As noted in our chart books for many weeks, there are segments following recent price action that we haven’t wanted to be exposed to, including Semiconductor and various technology industries, but the market has been providing rotation opportunities that allowed us to maintain our overall equity exposure. Members can stay on top of our thinking and what we are watching in our regular reports, as well as view what we are targeting in our list of market segments to either Accumulate or Avoid
Today, in our Market Outlook to subscribers, we discuss the following:
- Weekly look at the large-cap benchmark and how we are positioning
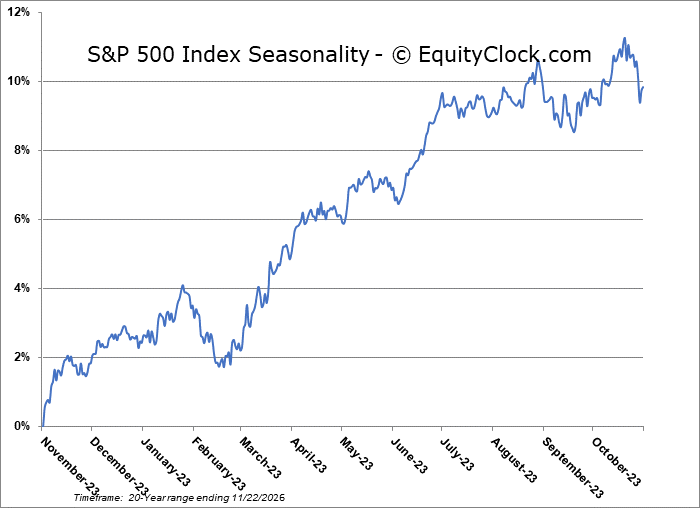
- Thanksgiving Week lift in stocks
- Headwinds that were a threat to risk assets previously are fading
- Excess fear
- Cues that have historically aligned with significant market lows
- Canadian Retail Sales
- US and Canadian Dollar
- Additional Thoughts (Semiconductors, Gold/Silver)
Subscribers can look for this report in their inbox or by clicking on the following link and logging in: Market Outlook for November 23
Not signed up yet? Subscribe now to receive full access to all of the research and analysis that we publish
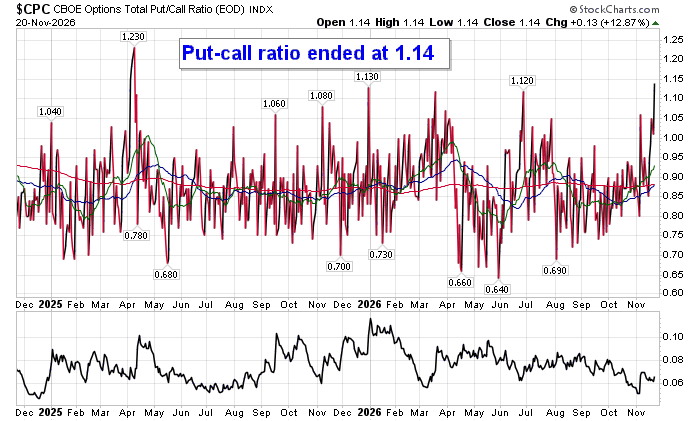
Sentiment on Friday, as gauged by the put-call ratio, ended bearish at 1.14. As highlighted above, this is the highest level since April of 2025.
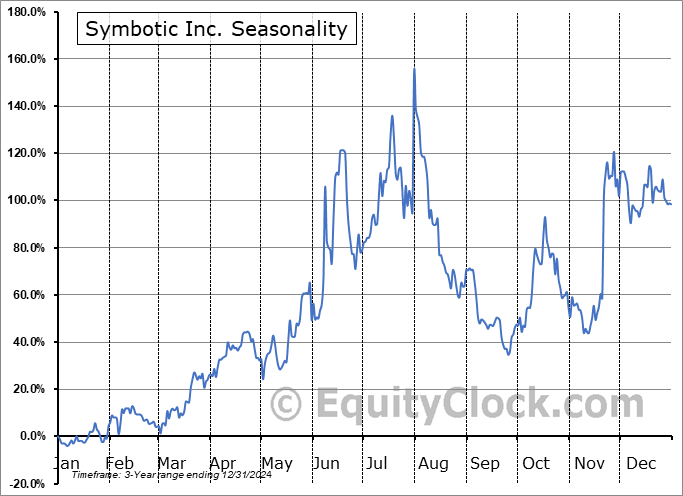
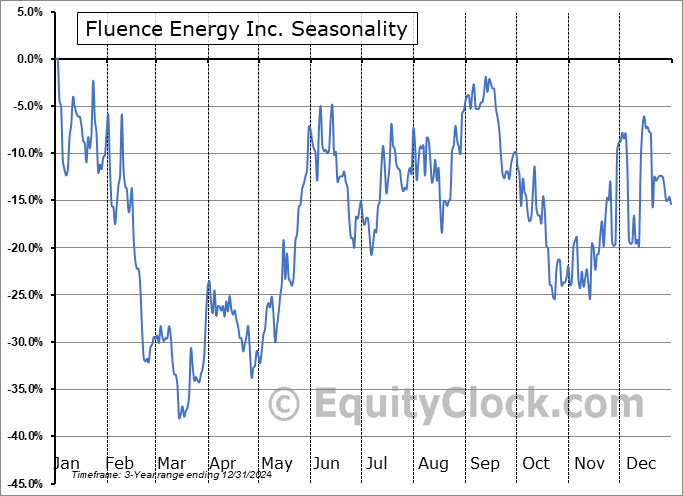
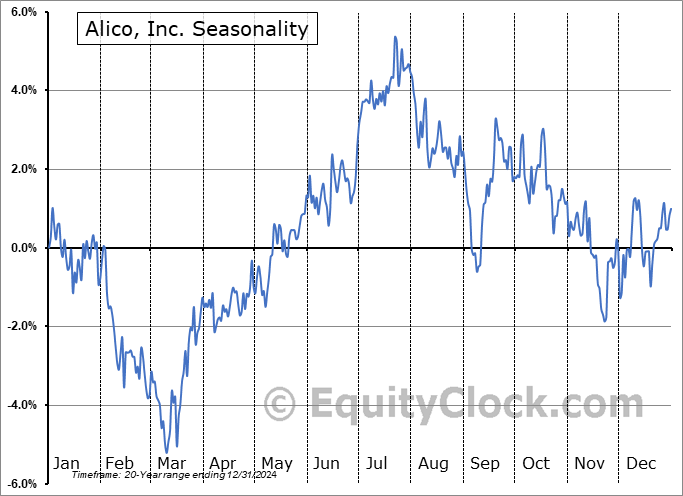
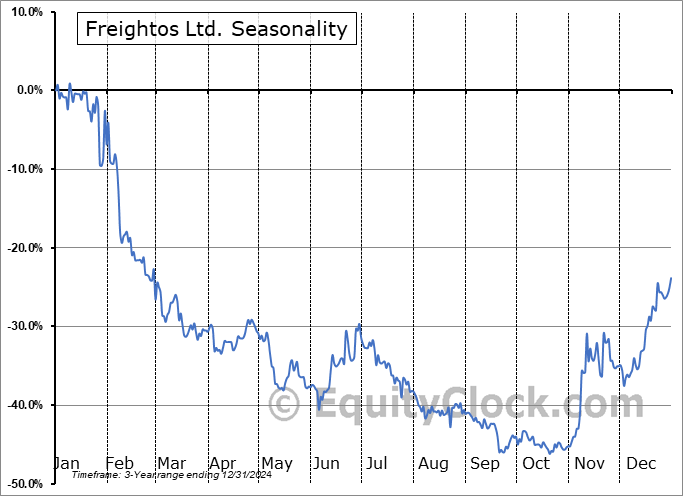
Seasonal charts of companies reporting earnings today:






S&P 500 Index
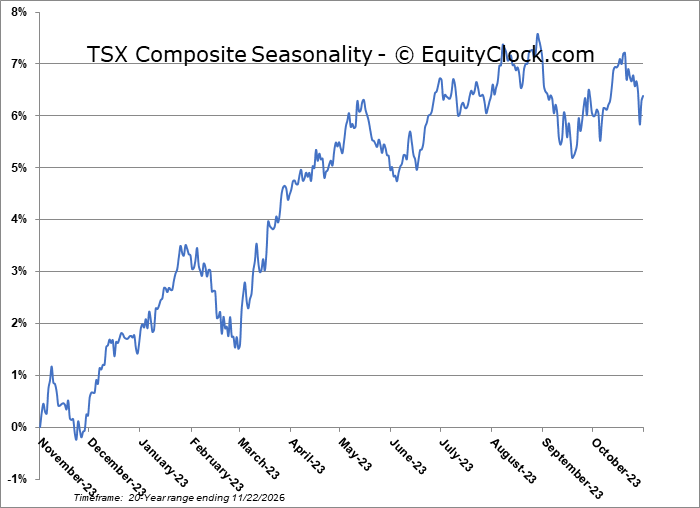
TSE Composite
| Sponsored By... |

|


