Stock Market Outlook for November 20, 2024

While hard data continues to paint a fairly bleak state of the manufacturing economy in the US, a jump in manufacturer sentiment for November highlights that this cohort is expecting better days ahead.
*** Stocks highlighted are for information purposes only and should not be considered as advice to purchase or to sell mentioned securities. As always, the use of technical and fundamental analysis is encouraged in order to fine tune entry and exit points to average seasonal trends.
Stocks Entering Period of Seasonal Strength Today:
Subscribers Click on the relevant link to view the full profile. Not a subscriber? Signup here.
VanEck Vectors Low Carbon Energy ETF (AMEX:SMOG) Seasonal Chart
SPDR S&P Metals and Mining ETF (NYSE:XME) Seasonal Chart
Timken Steel Corp. (NYSE:TMST) Seasonal Chart
Warrior Met Coal Inc. (NYSE:HCC) Seasonal Chart
Rekor Systems, Inc. (NASD:REKR) Seasonal Chart
Deutsche Bank AG (NYSE:DB) Seasonal Chart
Public Storage, Inc. (NYSE:PSA) Seasonal Chart
Banco Santander SA (NYSE:SAN) Seasonal Chart
Wheaton Precious Metals Corp. (NYSE:WPM) Seasonal Chart
Coherent Corp. (NYSE:COHR) Seasonal Chart
Amedisys (NASD:AMED) Seasonal Chart
M/I Homes, Inc. (NYSE:MHO) Seasonal Chart
Herc Holdings Inc. (NYSE:HRI) Seasonal Chart
KB Home (NYSE:KBH) Seasonal Chart
Icahn Enterprises L.P. (NASD:IEP) Seasonal Chart
Teck Resources Ltd. (NYSE:TECK) Seasonal Chart
Proto Labs Inc. (NYSE:PRLB) Seasonal Chart
Energizer Holdings, Inc. (NYSE:ENR) Seasonal Chart
The Markets
Stocks continued to grind higher early into this new week as dollar and rate headwinds alleviate. The S&P 500 Index closed higher by four-tenths of one percent, continuing to bounce from support at the 20-day moving average (5865), along with gap support that was opened around two weeks ago between 5783 and 5864, a zone that was reasonable to be filled before the march higher aligned with seasonal norms continues around the US Thanksgiving holiday. On a intermediate-term scale, there remains greater evidence of support than resistance, presenting the desired backdrop for strength that is normally realized in the market at year-end. Major moving averages are all pointed higher and momentum indicators continue to gyrate above their middle lines, providing characteristics of a bullish trend. We continue to like how our list of candidates in the market to Accumulate and to Avoid is positioned, but we are cognizant of changing market dynamics as revelations pertaining to Trump’s initiatives become apparent and as dollar/rate headwinds grow. We continue to scrutinize whether any changes are required in the days/weeks ahead as the price action evolves.
Today, in our Market Outlook to subscribers, we discuss the following:
- Near-term downside exhaustion in bond prices has materialized around levels of significance
- The rebound in interest rate sensitive sectors
- Precious metal exposure rebounding from levels of support
- US Industrial Production and the investment implications within
- The surge in New York manufacturer sentiment
Subscribers can look for this report in their inbox or by clicking on the following link and logging in: Market Outlook for November 20
Not signed up yet? Subscribe now to receive full access to all of the research and analysis that we publish.
Investor sentiment on Tuesday, as gauged by the put-call ratio, ended bullish at 0.82.
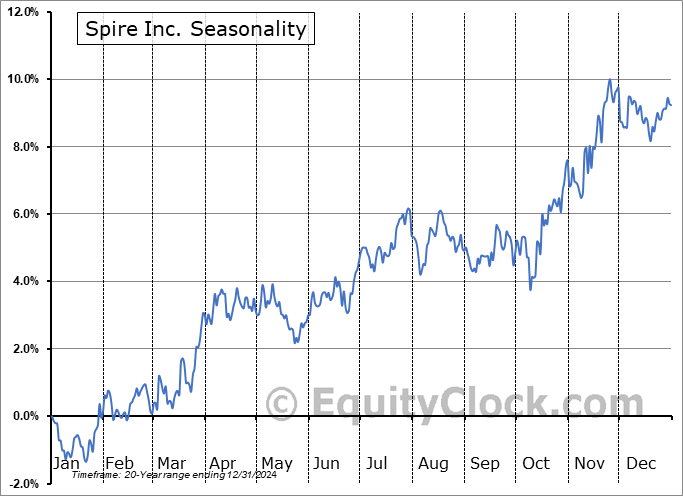
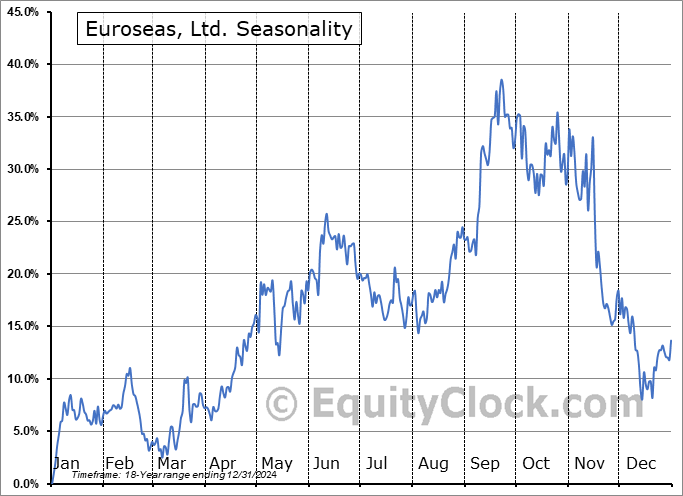
Seasonal charts of companies reporting earnings today:
S&P 500 Index
TSE Composite
| Sponsored By... |

|


