Stock Market Outlook for March 26, 2026
Rising Oil prices have traditionally been positive for the performance of Transportation stocks.
*** Stocks highlighted are for information purposes only and should not be considered as advice to purchase or to sell mentioned securities. As always, the use of technical and fundamental analysis is encouraged in order to fine tune entry and exit points to average seasonal trends.
Stocks Entering Period of Seasonal Strength Today:
Subscribers Click on the relevant link to view the full profile. Not a subscriber? Signup here.
Stock Highlight: |
|

CES Energy Solutions Corp. (TSE:CEU.TO) Seasonal Chart |
|

Forum Energy Technologies, Inc. (NYSE:FET) Seasonal Chart

NexPoint Residential Trust, Inc. (NYSE:NXRT) Seasonal Chart

RCM Technologies, Inc. (NASD:RCMT) Seasonal Chart
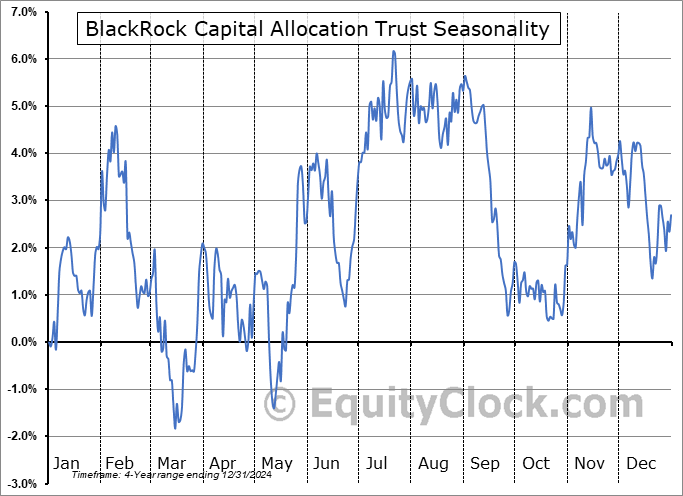
BlackRock Capital Allocation Trust (NYSE:BCAT) Seasonal Chart

Lassonde Industries, Inc. (TSE:LAS/A.TO) Seasonal Chart

CarParts.com (NASD:PRTS) Seasonal Chart

Acadia Healthcare Company, Inc. (NASD:ACHC) Seasonal Chart
Disclaimer: Comments and opinions offered in this report are for information only. They should not be considered as advice to purchase or to sell mentioned securities. Data offered is believed to be accurate, but is not guaranteed.
The Markets
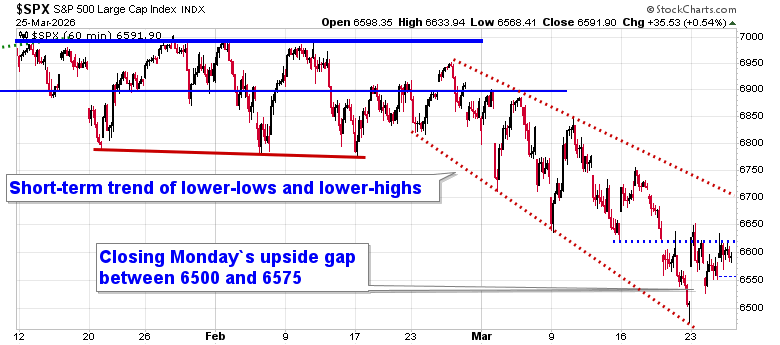
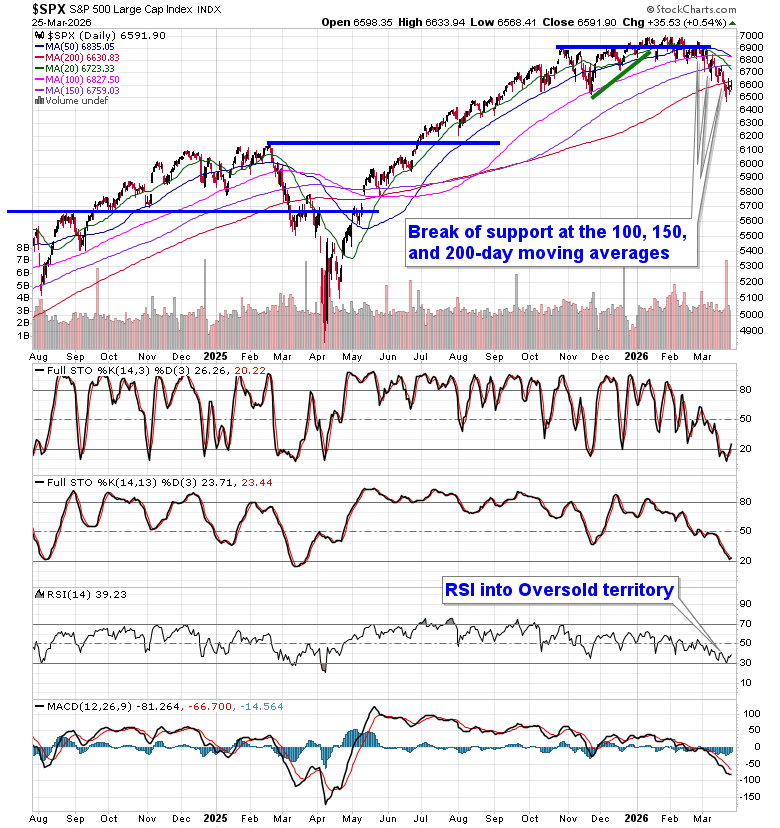
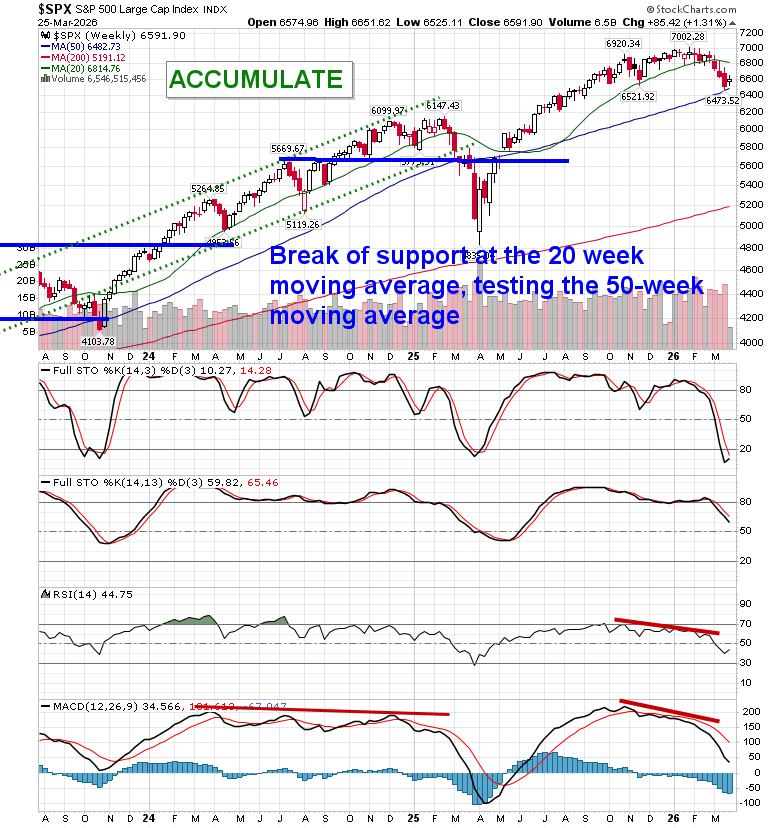
Stocks traded higher on Wednesday as the perception that Donald Trump is seeking an off-ramp to the war in Iran helped to alleviate some of the burdens influencing equity markets in recent days (eg. price of oil, cost of borrowing). The S&P 500 Index closed higher by around half of one percent, curling higher from the substantial upside gap charted at Monday’s open between 6500 and 6575; it remains important for the period of seasonal strength in the equity markets through the weeks ahead that this span holds. The benchmark continues to abide by the limits of its declining trend channel (lower limit was tested on Friday) and the band between 6500 and 6600 that we have speculated as likely to provide support is holding, for now. The upper limit of the declining trend channel from the past month that the hourly chart presents is around 6700, reaction to which will be heavily scrutinized. The longer-term technical profile of the market does present concerns, but it is the near-term, heading into the seasonally strong period during the month of April, that we have our focus on and that suggests the risk reward has become appropriate to hold an elevated level of risk through the weeks ahead. In the Seasonal Advantage Portfolio that we manage for clients at CastleMoore, we rotated away from our low volatility posture and added to risk exposure at the end of last week for the seasonally strong window that runs through the next four to six weeks. The conflict in Iran remains a wildcard, but we do not have the indications that would be required to suggest abandoning our seasonal mandate calling for strength in stocks at least into early April; beyond this period, we certainly have concerns and we will look to address each of them in our reports to subscribers through the weeks ahead. Subscribers can view the themes in our chart books to either Accumulate or Avoid that are working and intact.
Today, in our Market Outlook to subscribers, we discuss the following:
- Market Action: Relief Rally Continues
- Macro Driver: Iran De-Escalation Is the Catalyst
- Technical Setup: Tactical Bullish, Structurally Cautious
- Key Market Signals to Monitor
- Transportation Stocks
- Oil Market: Transitioning from Spike to Stabilization
- Energy Trade: Equities Over Commodity
- Oil & Transports: Counterintuitive Bullish Link
- Energy Supply/Demand: Near-Term Relief Window
Subscribers can look for this report in their inbox or by clicking on the following link and logging in: Market Outlook for March 26
Not signed up yet? Subscribe now to receive full access to all of the research and analysis that we publish
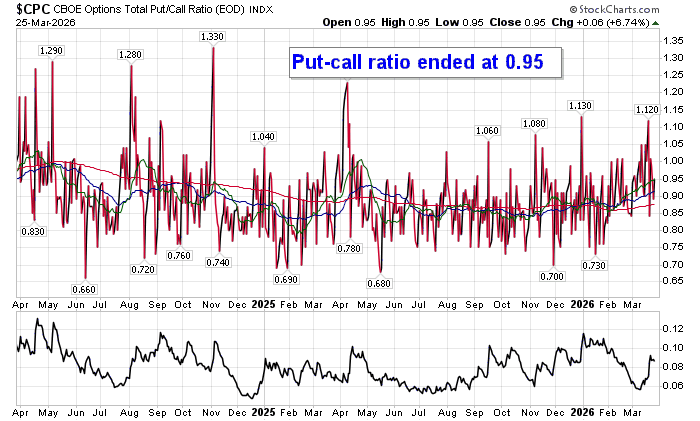
Sentiment on Wednesday, as gauged by the put-call ratio, ended bullish at 0.95.
Seasonal charts of companies reporting earnings today:


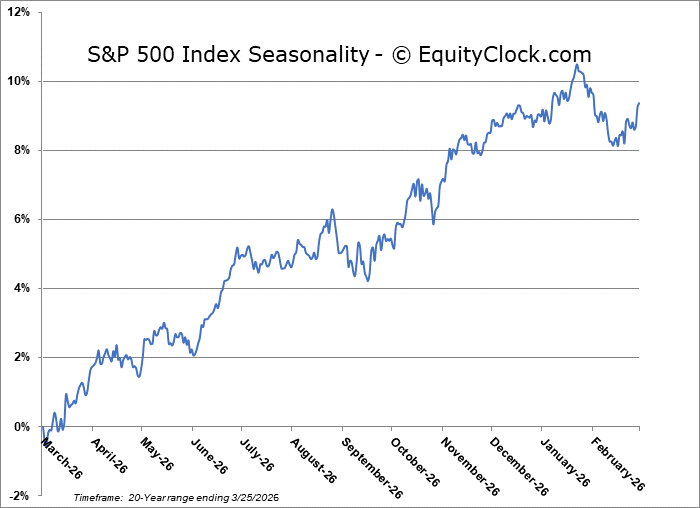
S&P 500 Index
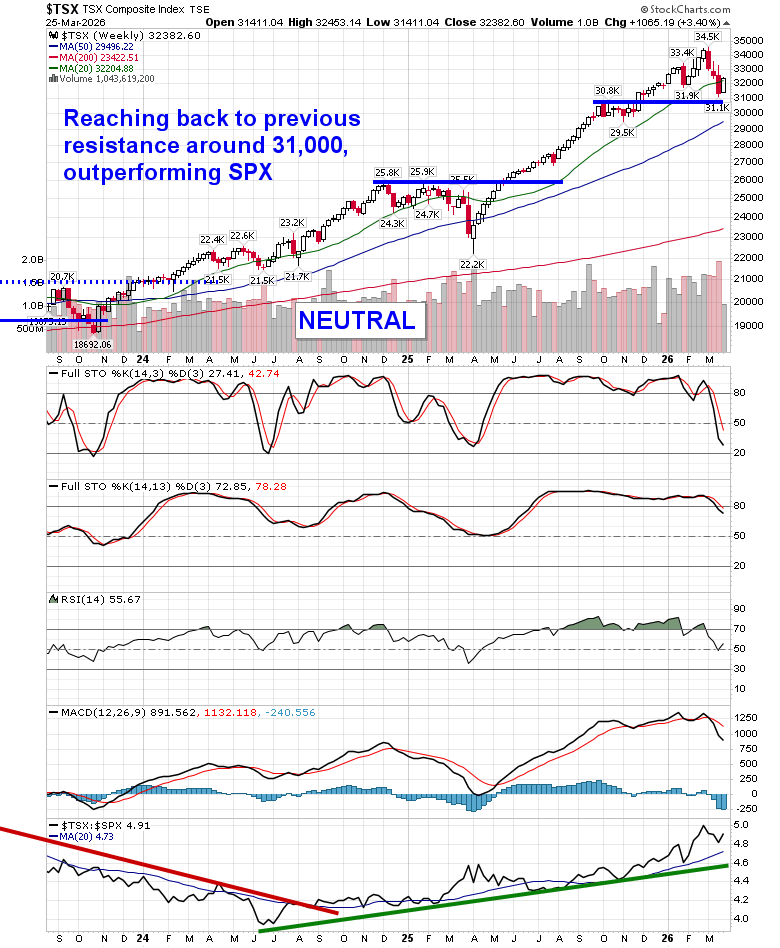
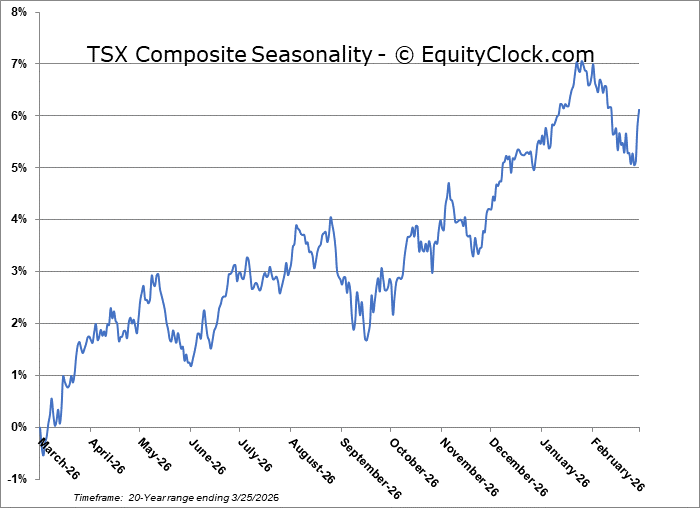
TSE Composite
| Sponsored By... |

|


