Stock Market Outlook for April 15, 2026

Indicators are in consensus that this may be the logical point for a pause in the recovery of stocks to materialize.
*** Stocks highlighted are for information purposes only and should not be considered as advice to purchase or to sell mentioned securities. As always, the use of technical and fundamental analysis is encouraged in order to fine tune entry and exit points to average seasonal trends.
Stocks Entering Period of Seasonal Strength Today:
Subscribers Click on the relevant link to view the full profile. Not a subscriber? Signup here.
Stock Highlight: |
|

Meta Financial Group, Inc. (NASD:CASH) Seasonal Chart |
|

Sunrun Inc. (NASD:RUN) Seasonal Chart

ProShares Short VIX Short-Term Futures ETF (AMEX:SVXY) Seasonal Chart

Ellsworth Fund Ltd. (AMEX:ECF) Seasonal Chart

Ally Financial Inc. (NYSE:ALLY) Seasonal Chart

National Research Corp. (NASD:NRC) Seasonal Chart

MFA Financial Inc. (NYSE:MFA) Seasonal Chart
Disclaimer: Comments and opinions offered in this report are for information only. They should not be considered as advice to purchase or to sell mentioned securities. Data offered is believed to be accurate, but is not guaranteed.
The Markets
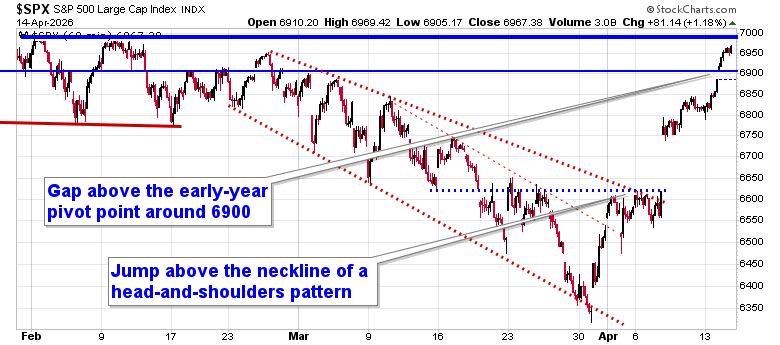
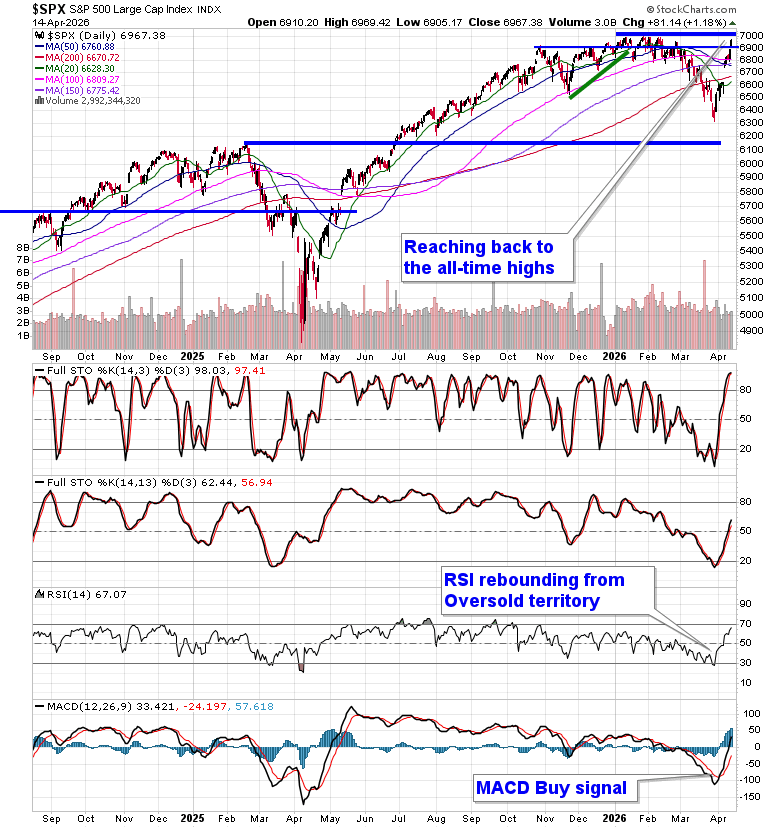
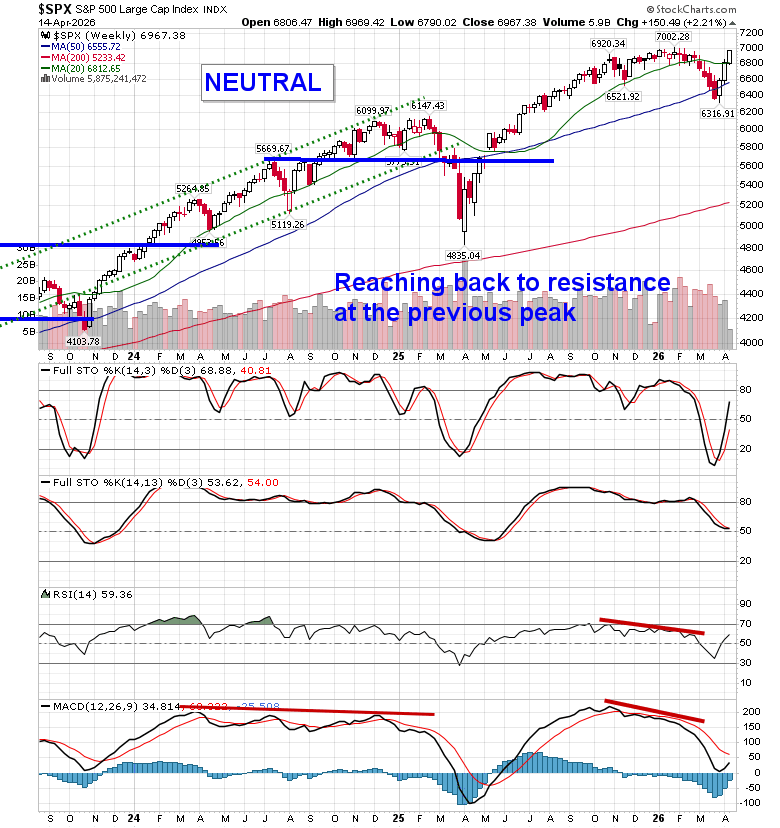
Stocks continued to move higher on Tuesday as the rebound from the lows forces the shorts to cover their negative bets. The S&P 500 Index closed up by 1.18%, continuing to leave last Wednesday’s gap that was opened between 6620 and 6740 unfilled. A head-and-shoulders bottoming pattern that saw its neckline around 6620 remains in play, a technical setup that proposed an upside resolution to 6900 (now broken). The benchmark is now into a range of supply around the previous peak (~7000), leaving open the possibility of reaction (and gap fill) in the near-term, but, ultimately, the character of the market has changed where levels of resistance hold less weight than levels of support. A small upside gap opened on Tuesday between 6885 and 6905 is the first zone to watch for reaction as potential support on a retracement/digestion of recent gains. Momentum indicators continue to rise and there is no actionable evidence that the recovery from the March low has matured (although we did find more segments of the market that were worthy to sell/short than to buy in our last chart books review). In the Seasonal Advantage Portfolio (which is strongly higher YTD and exceeding its high watermark that was charted in February) that we manage for clients at CastleMoore, we continue to be fully exposed to risk (stocks) after flipping from our low volatility stance around the end of March and our performance is benefitting. The conflict in Iran remains a wildcard and we are running down our cues that would warrant a more defensive posture in risk assets. Subscribers can view the updated list of themes in our chart books to either Accumulate or Avoid that we continue to gear portfolios towards.
Today, in our Market Outlook to subscribers, we discuss the following:
- Market Trend & Technical Setup
- Logical Levels for Near-Term Pause / Exhaustion
- Strategy & Positioning Shift
- Sector & Allocation Insights
- Economic Signals: Housing and Producer Prices
- Sentiment Warning
- Big Picture Takeaway
Subscribers can look for this report in their inbox or by clicking on the following link and logging in: Market Outlook for April 15
Not signed up yet? Subscribe now to receive full access to all of the research and analysis that we publish
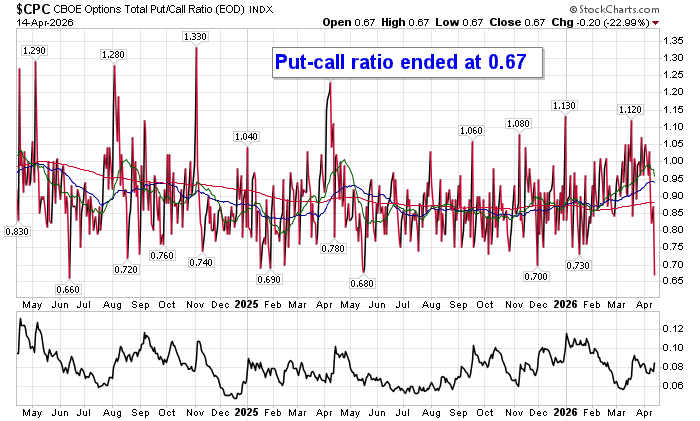
Sentiment on Tuesday, as gauged by the put-call ratio, ended overly bullish at 0.67.
Seasonal charts of companies reporting earnings today:


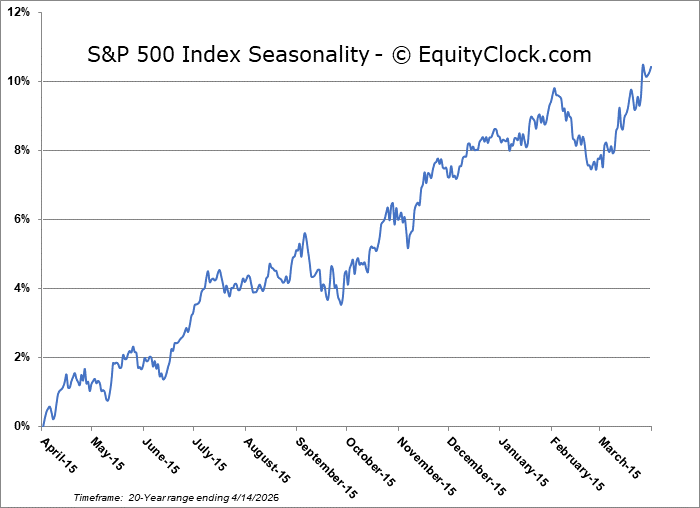
S&P 500 Index
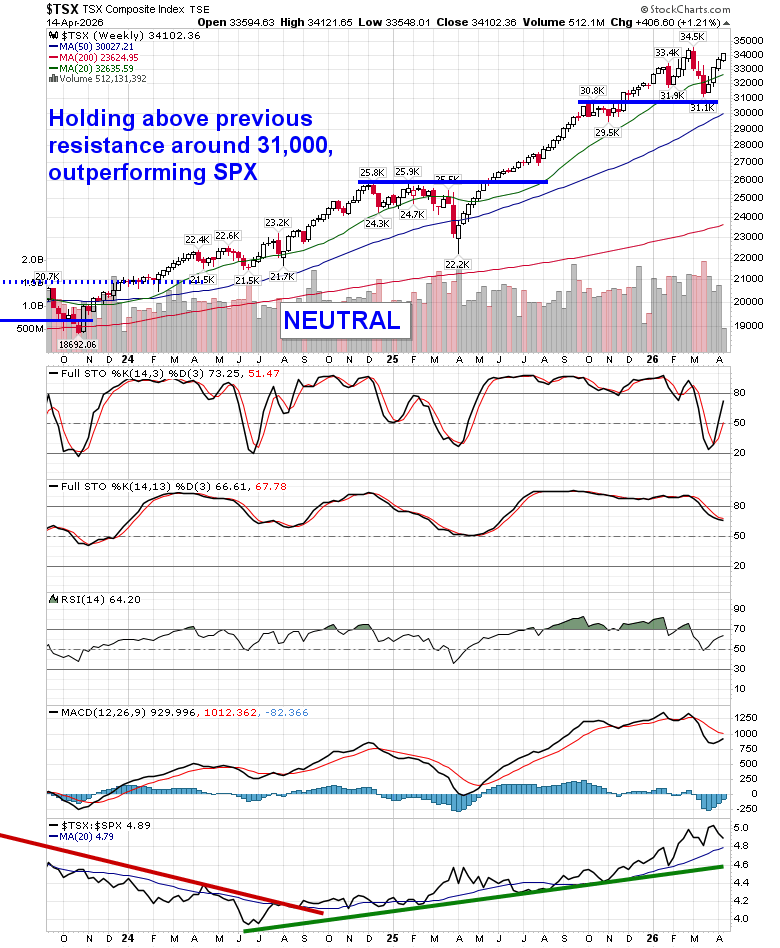
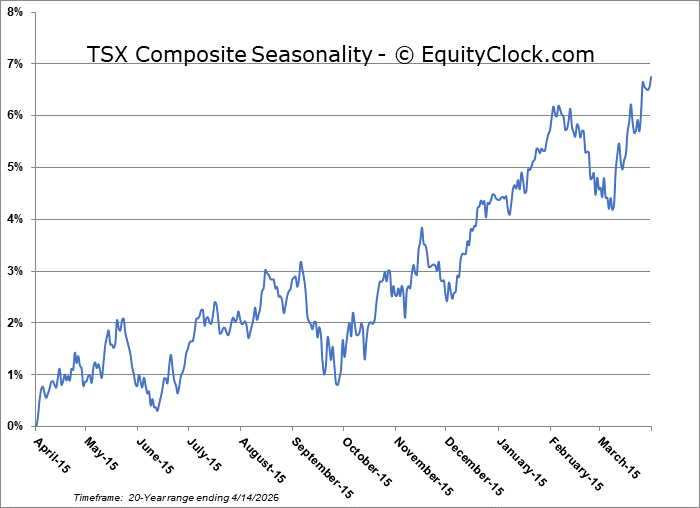
TSE Composite
| Sponsored By... |

|


