Stock Market Outlook for May 12, 2026

Banks are rolling over, providing a warning signal for the economy and the equity market.
*** Stocks highlighted are for information purposes only and should not be considered as advice to purchase or to sell mentioned securities. As always, the use of technical and fundamental analysis is encouraged in order to fine tune entry and exit points to average seasonal trends.
Stocks Entering Period of Seasonal Strength Today:
Subscribers Click on the relevant link to view the full profile. Not a subscriber? Signup here.
Stock Highlight: |
|

Xcel Energy (NASD:XEL) Seasonal Chart |
|
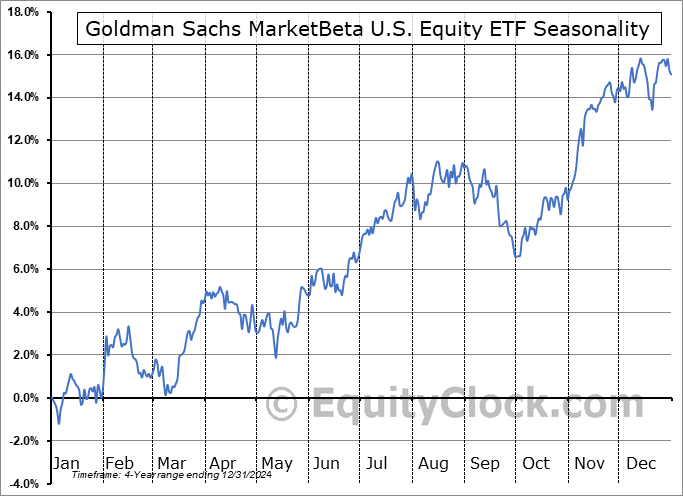
Goldman Sachs MarketBeta U.S. Equity ETF (AMEX:GSUS) Seasonal Chart

Calamos Strategic Total Return Fund (NASD:CSQ) Seasonal Chart

iShares Russell 1000 Growth ETF (NYSE:IWF) Seasonal Chart

Global X FinTech Thematic ETF (NASD:FINX) Seasonal Chart
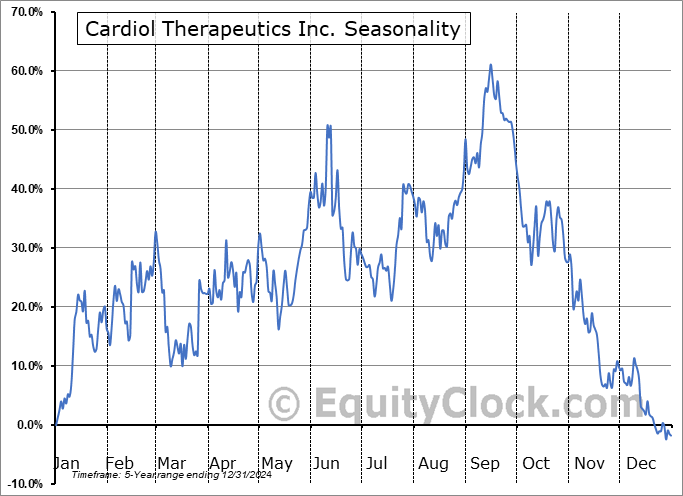
Cardiol Therapeutics Inc. (NASD:CRDL) Seasonal Chart

Apollo Commercial Real Estate Finance, Inc. (NYSE:ARI) Seasonal Chart

Amplify Transformational Data Sharing ETF (AMEX:BLOK) Seasonal Chart

Applied Digital Corporation (NASD:APLD) Seasonal Chart
Disclaimer: Comments and opinions offered in this report are for information only. They should not be considered as advice to purchase or to sell mentioned securities. Data offered is believed to be accurate, but is not guaranteed.
The Markets
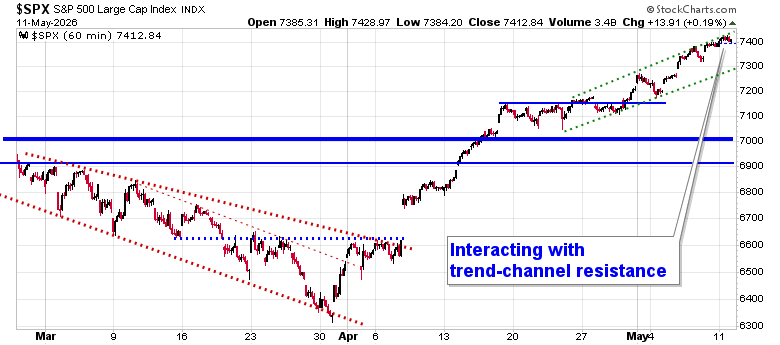
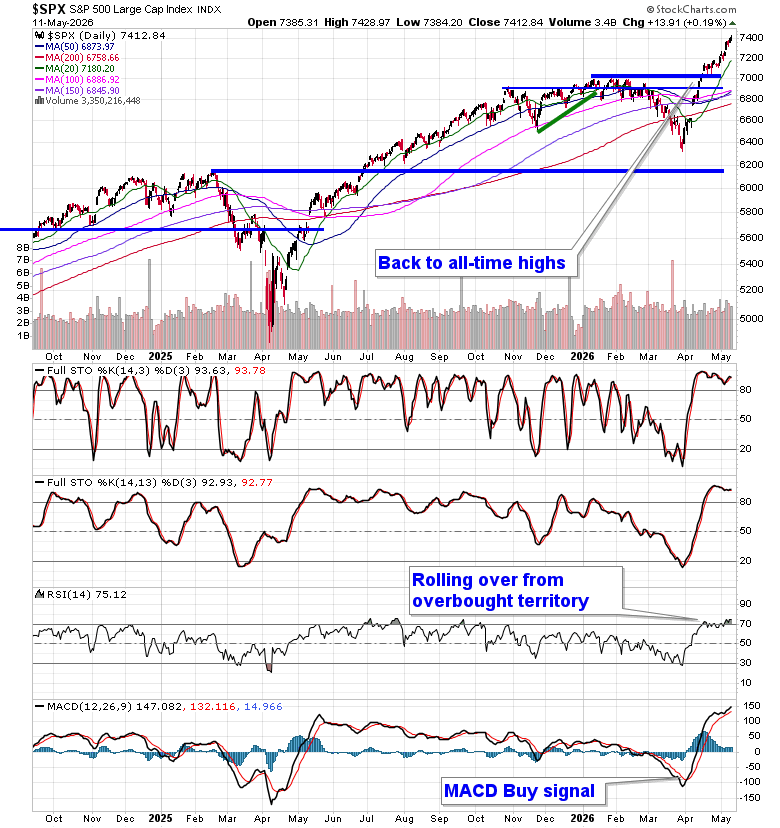
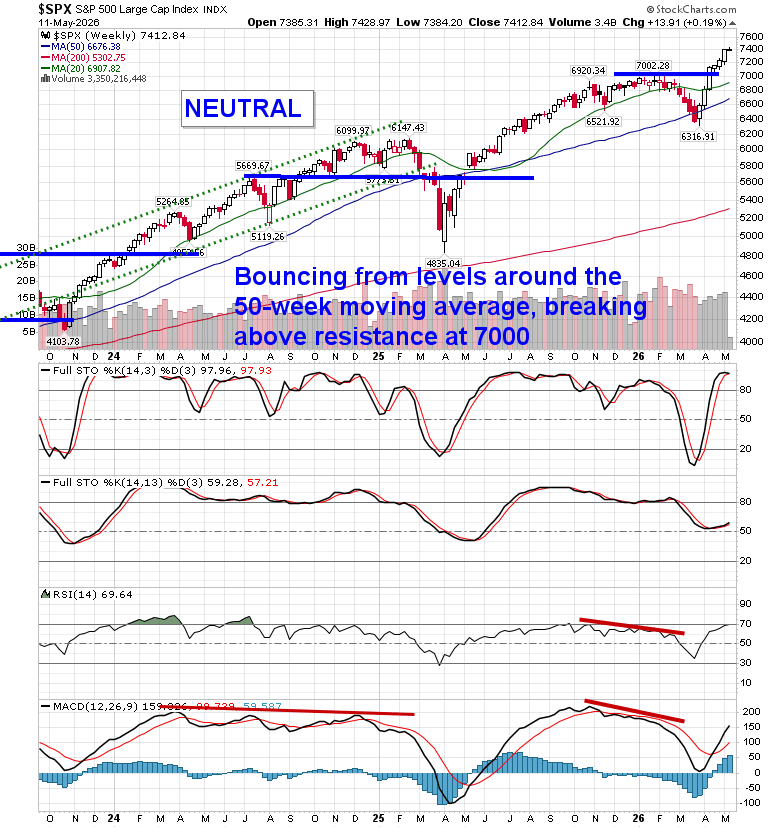
A jump in the price of oil failed to derail the re-hot technology trade that has driven major benchmarks to fresh record highs. The S&P 500 Index gained just less than two-tenths of one percent, interacting with short-term rising trend channel resistance that has been carved out in the past couple of weeks. The lower limit of the rising span can be pegged close to 7300, a hurdle that also represents an open gap that was charted last week. The gaps beneath the market, looked to as levels of support, continue to accumulate, including the big one between 6620 and 6740, and, ultimately, the character of the market has changed where levels of resistance hold less weight than levels of support. As the market continues to move higher, so too do downside risks in the near-term, which can now be pegged towards levels around 7000 (the January highs). We are still playing with a positive side bias (albeit with hedges that have been added in recent weeks– see our April 22 Market Outlook). Momentum indicators continue to show signs of stall around overbought territory and there remains indication of upside exhaustion that could lend to a digestive phase on the horizon, particularly now that we are moving beyond the height to earnings season. In the Seasonal Advantage Portfolio (which is strongly higher YTD, continuing to set new high watermarks) that we manage for clients at CastleMoore, we continue to be fully exposed to risk (stocks) after flipping from our low volatility stance around the end of March and our performance has been excellent (strongly outperforming the S&P 500 Index, Nasdaq Composite, and TSX Composite). The conflict in Iran remains a wildcard (and we are skeptical of the suggestion of a return to normal that the market is seemingly pricing in), but we have cues that we are following that would warrant abandoning our risk-on view and move towards a more defensive posture in risk assets. Subscribers can view the themes in our chart books to either Accumulate or Avoid that we continue to gear portfolios towards.
Want to know which areas of the market to buy or sell? Our Weekly Chart Books have just been updated, providing a clear Accumulate, Avoid, or Neutral rating for currencies, cryptocurrencies, commodities, broad markets, and subsectors/industries of the market. Subscribers can login and click on the relevant links to access.
- Currencies
- Cryptocurrencies
- Commodities
- Major Benchmarks
- Sub-sectors / Industries
- ETFs: Bonds | Commodities | Equity Markets | Industries | Sectors
Subscribe now.
Today, in our Market Outlook to subscribers, we discuss the following:
- Our weekly chart books update, along with our list of all segments of the market to either Accumulate or Avoid
- Other Notes
Subscribers can look for this report in their inbox or by clicking on the following link and logging in: Market Outlook for May 12
Not signed up yet? Subscribe now to receive full access to all of the research and analysis that we publish
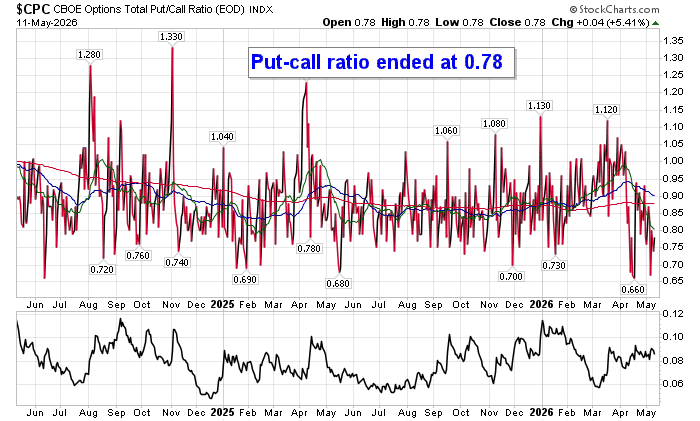
Sentiment on Monday, as gauged by the put-call ratio, ended bullish at 0.78.
Seasonal charts of companies reporting earnings today:


S&P 500 Index
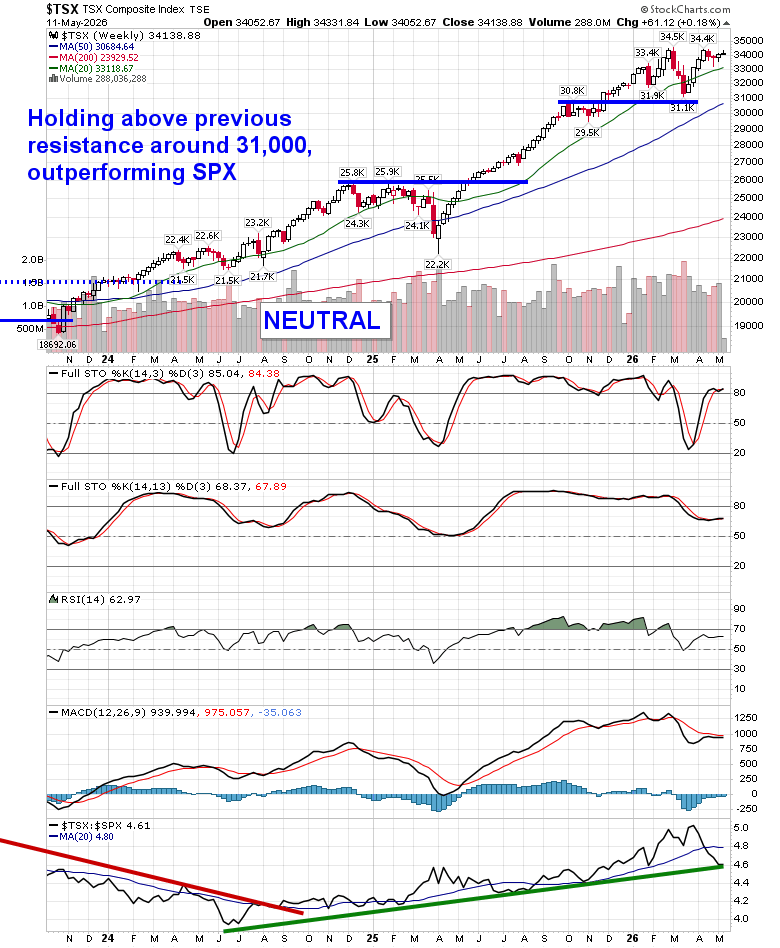
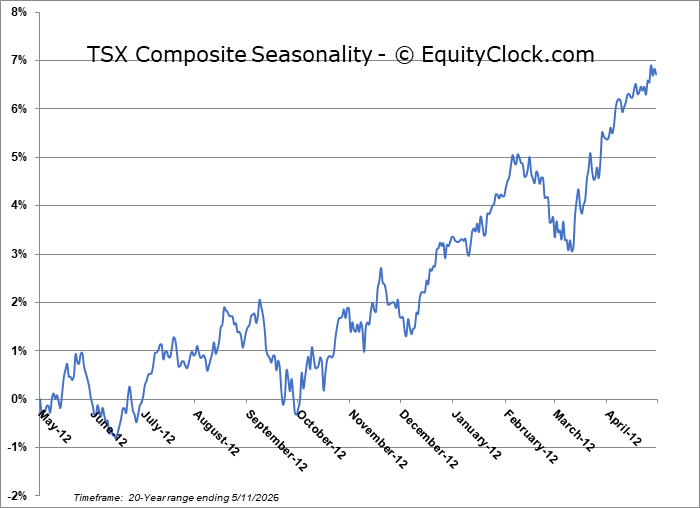
TSE Composite
| Sponsored By... |

|


