Stock Market Outlook for May 13, 2026

The cues have stacked up to take defensive action in portfolios during this normally week mid-May period for stocks.
*** Stocks highlighted are for information purposes only and should not be considered as advice to purchase or to sell mentioned securities. As always, the use of technical and fundamental analysis is encouraged in order to fine tune entry and exit points to average seasonal trends.
Stocks Entering Period of Seasonal Strength Today:
Subscribers Click on the relevant link to view the full profile. Not a subscriber? Signup here.
Stock Highlight: |
|

Powell Industries, Inc. (NASD:POWL) Seasonal Chart |
|

BMO NASDAQ 100 Equity Hedged to CAD Index ETF (TSE:ZQQ.TO) Seasonal Chart
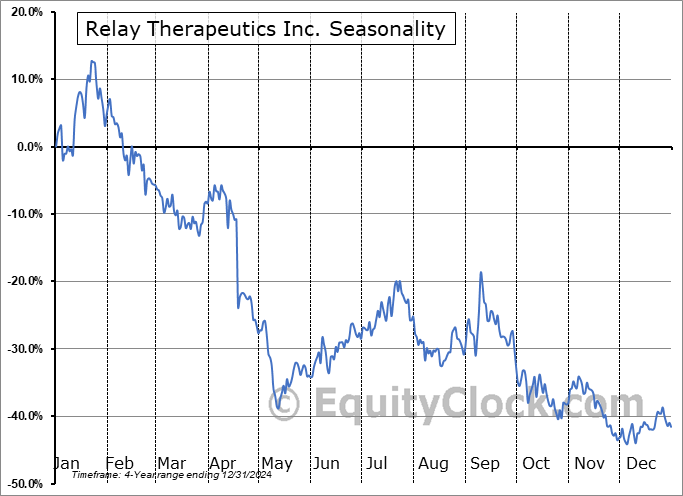
Relay Therapeutics Inc. (NASD:RLAY) Seasonal Chart

Saul Centers, Inc. (NYSE:BFS) Seasonal Chart

Energy Fuels Inc. (AMEX:UUUU) Seasonal Chart

Trimas Corp. (NASD:TRS) Seasonal Chart

Omnicell Inc. (NASD:OMCL) Seasonal Chart

Kopin Corp. (NASD:KOPN) Seasonal Chart

PTC, Inc. (NASD:PTC) Seasonal Chart
Disclaimer: Comments and opinions offered in this report are for information only. They should not be considered as advice to purchase or to sell mentioned securities. Data offered is believed to be accurate, but is not guaranteed.
The Markets
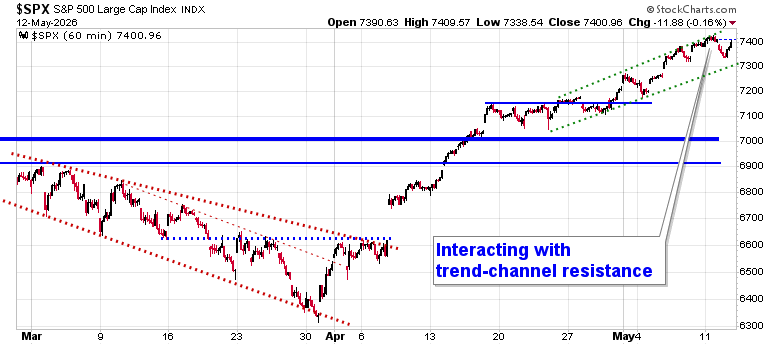
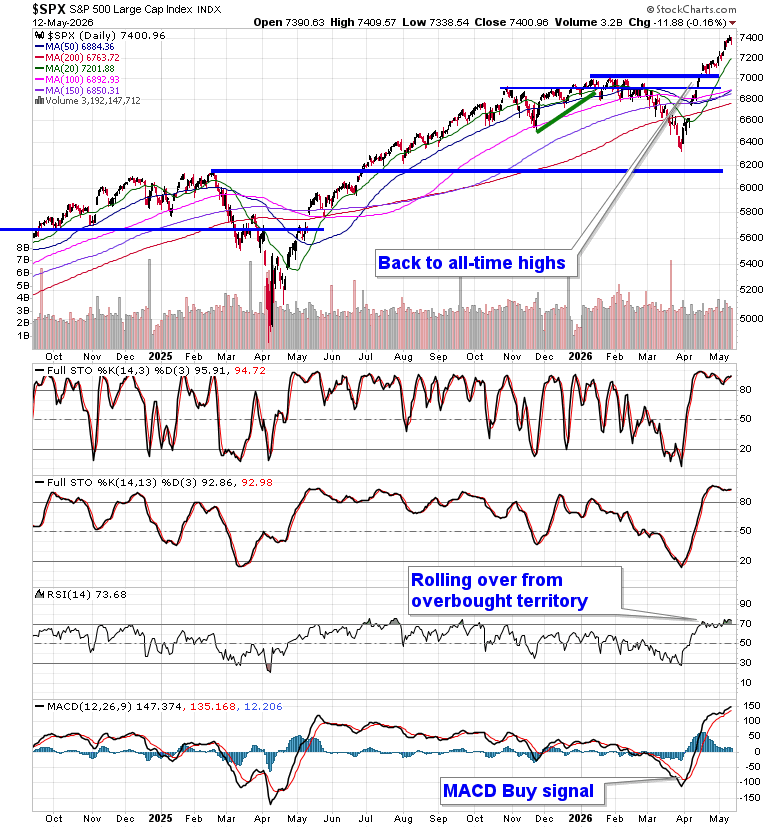
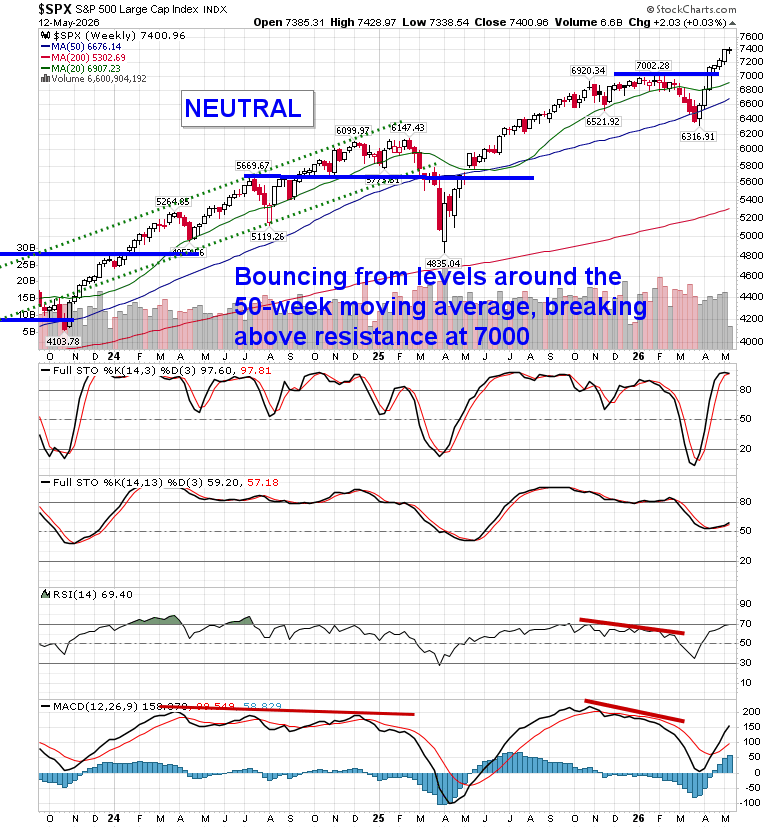
A hot inflation report, a jump in the price of oil, and the rising cost of borrowing got traders a little nervous on Tuesday, causing them to pullback/book profits in some of the red-hot technology/semiconductor plays from recent weeks. The S&P 500 Index shed just less than two-tenths of one percent, trading into the mid-point of its rising trend channel that has been carved out in the past couple of weeks. The lower limit of the rising span can be pegged close to 7300, a hurdle that also represents an open gap that was charted last week. The gaps beneath the market, looked to as levels of support, continue to accumulate, including the big one between 6620 and 6740, and, ultimately, the character of the market has changed where levels of resistance hold less weight than levels of support. As the market continues to move higher, so too do downside risks in the near-term, which can now be pegged towards levels around 7000 (the January highs). Momentum indicators continue to show signs of stall around overbought territory and there remains indication of upside exhaustion that could lend to a digestive phase on the horizon, particularly now that we are moving beyond the height to earnings season. In the Seasonal Advantage Portfolio (which is strongly higher YTD, continuing to set new high watermarks) that we manage for clients at CastleMoore, we have been busy moving around over the past couple of sessions, not by selling out of the market, but rather rotating within in it (more details on that below). The conflict in Iran remains a wildcard and some of the cues that we have been following that would warrant moving towards a more defensive posture in risk assets have started to trigger. Subscribers can view the themes in our chart books to either Accumulate or Avoid that we continue to gear portfolios towards.
Today, in our Market Outlook to subscribers, we discuss the following:
- Cost of borrowing has hit our red-line
- Health Care starting to click in, hinting of a shift in the market
- US Consumer Price Index (CPI) and the investment implications within
- Consumer Discretionary and Consumer Staples
- The action that we are taking in the Super Simple Seasonal Portfolio
Subscribers can look for this report in their inbox or by clicking on the following link and logging in: Market Outlook for May 13
Not signed up yet? Subscribe now to receive full access to all of the research and analysis that we publish
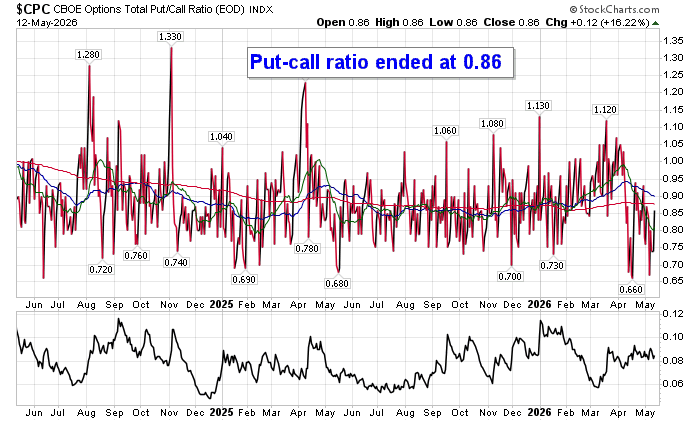
Sentiment on Tuesday, as gauged by the put-call ratio, ended bullish at 0.86.
Seasonal charts of companies reporting earnings today:


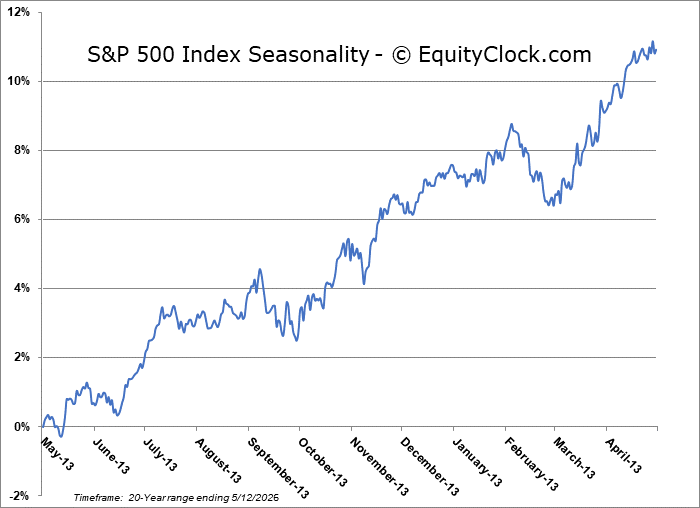
S&P 500 Index
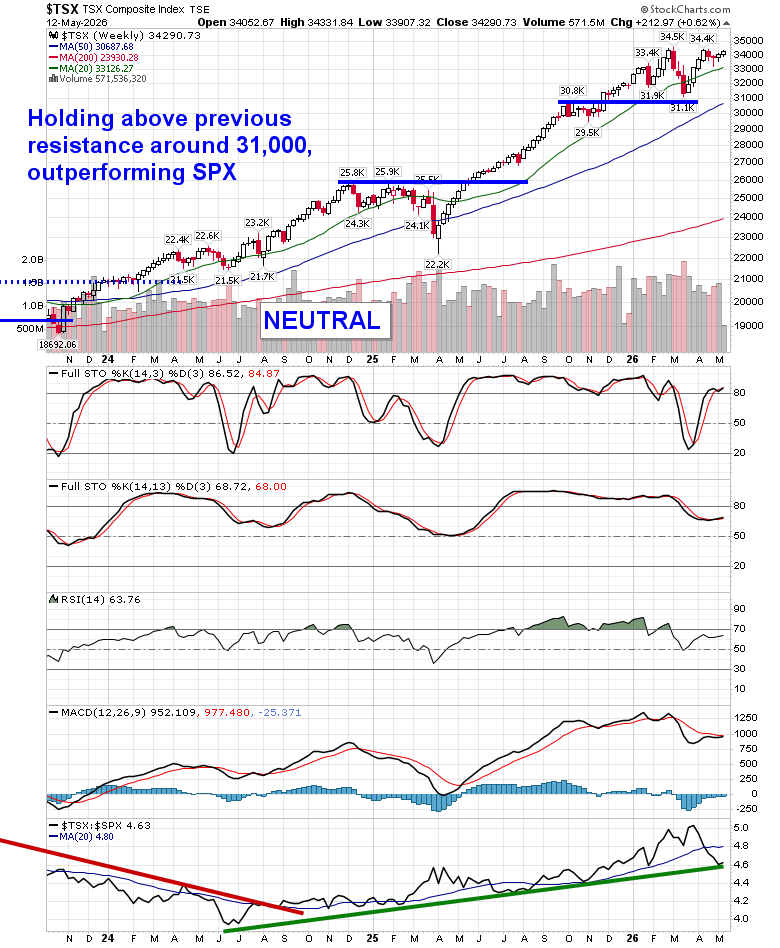
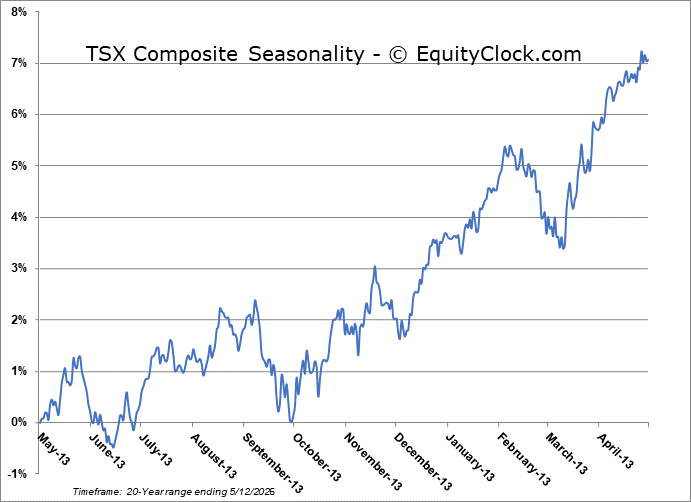
TSE Composite
| Sponsored By... |

|


