Stock Market Outlook for May 15, 2026

The gamma exposed tailwind may be set to go away following options expiration, lending to the normal consolidation/digestion of strength in equity prices during the middle of May.
*** Stocks highlighted are for information purposes only and should not be considered as advice to purchase or to sell mentioned securities. As always, the use of technical and fundamental analysis is encouraged in order to fine tune entry and exit points to average seasonal trends.
Stocks Entering Period of Seasonal Strength Today:
Subscribers Click on the relevant link to view the full profile. Not a subscriber? Signup here.
Stock Highlight: |
|

Ideal Power, Inc. (NASD:IPWR) Seasonal Chart |
|

SenesTech, Inc. (NASD:SNES) Seasonal Chart

PrimeEnergy Resources Corp. (NASD:PNRG) Seasonal Chart

iShares India 50 ETF (NASD:INDY) Seasonal Chart

MagnaChip Semiconductor Corp. (NYSE:MX) Seasonal Chart
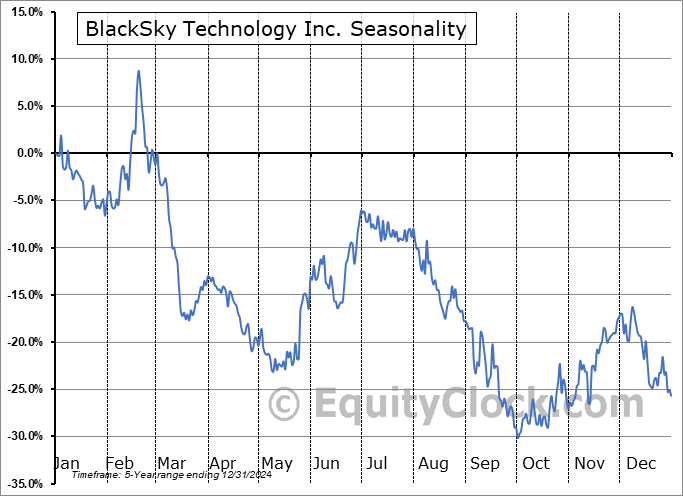
BlackSky Technology Inc. (NYSE:BKSY) Seasonal Chart

Invesco Dynamic Large Cap Growth ETF (NYSE:PWB) Seasonal Chart

Jabil, Inc. (NYSE:JBL) Seasonal Chart

Applied Optoelectronics Inc. (NASD:AAOI) Seasonal Chart

Schwab U.S. Large-Cap Growth ETF (NYSE:SCHG) Seasonal Chart

Lumentum Holdings Inc. (NASD:LITE) Seasonal Chart
Disclaimer: Comments and opinions offered in this report are for information only. They should not be considered as advice to purchase or to sell mentioned securities. Data offered is believed to be accurate, but is not guaranteed.
Note: ‘Tis the Season for May long weekends. Our schedule will be disrupted over the next couple of weeks, first from the Victoria Day long weekend that is now upon us and the Memorial Day long weekend thereafter. As a result, there will be no report published this weekend, however, our Weekly Chart Books will be updated and published on schedule on Sunday night. We will have our write-up on the chartbook updates in our intraday report to subscribers on Monday and our next daily Market Outlook report will be released on Tuesday. If you are celebrating this weekend, enjoy and we will catch-up with you next week. Stay on top of our social media (@EquityClock on X, StockTwits, Reddit, Instagram, and Bluesky) for any commentary/important developments in the interim.
The Markets
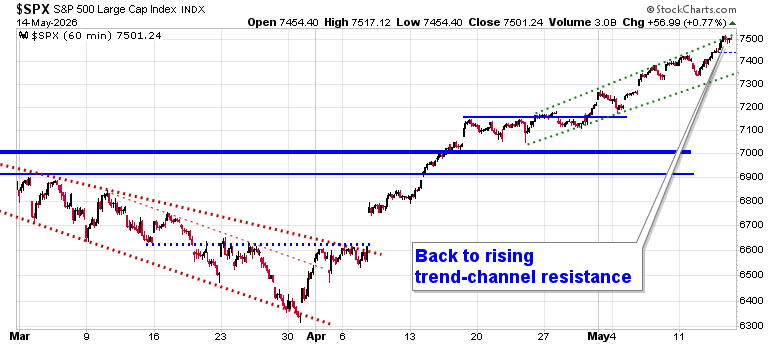
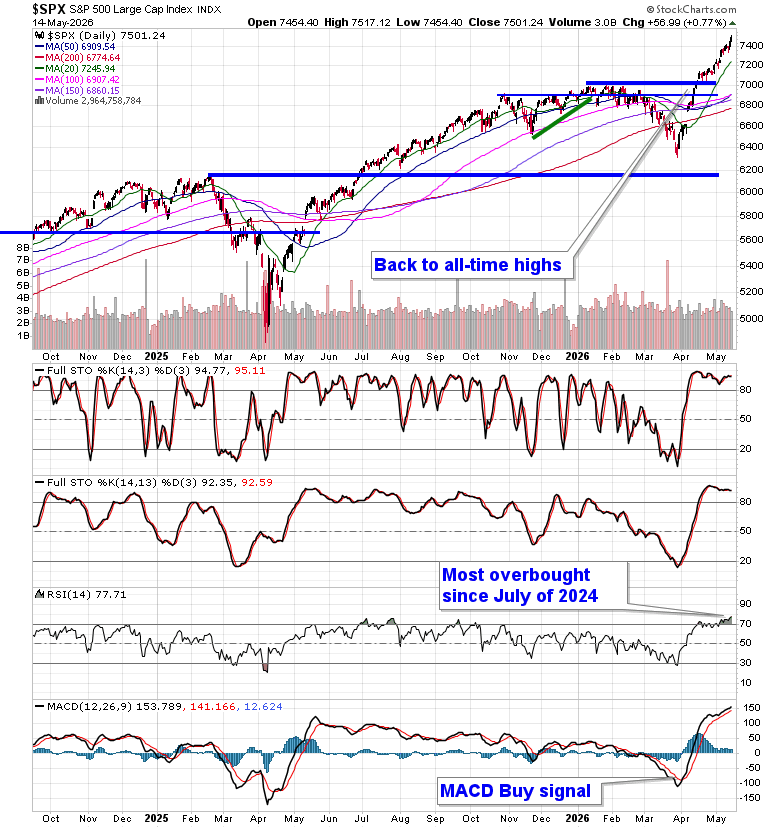
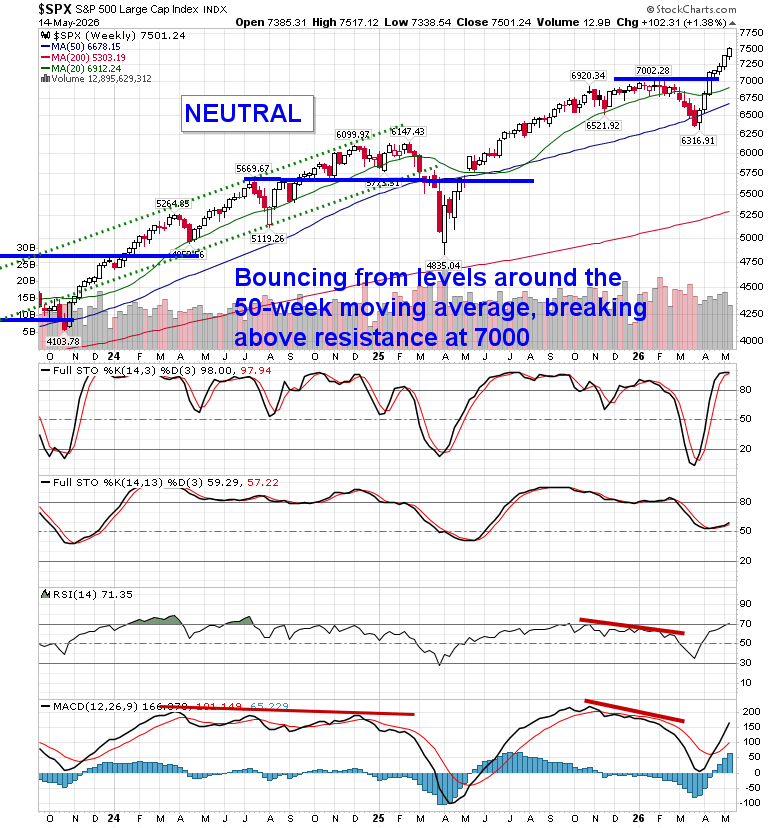
Optimism stemming from the meeting between Chinese and US leaders sent stocks higher on Thursday as investors flood further into the red-hot technology trade. The S&P 500 Index closed up by just less than eight-tenths of one percent, reaching back to the upper limit of the short-term rising trend channel that has been carved out in the past couple of weeks. The lower limit of the rising span can be pegged around 7350. The gaps beneath the market, looked to as levels of support, continue to accumulate, including the big one between 6620 and 6740, and, ultimately, the character of the market remains where levels of resistance hold less weight than levels of support. As the market continues to move higher, so too do downside risks in the near-term, which can now be pegged towards levels around 7000 (the January highs). The Relative Strength Index (RSI) on the daily chart has become the most overbought since July of 2024 and the risk of near-term upside exhaustion remains, something that could lend to a digestive phase on the horizon, particularly now that we are moving beyond the height to earnings season and potentially lose the positive gamma backdrop that the market has relished in over the past month (more on that below). However, so long as the path of the market over short, intermediate, and long-term timeframes remains that of higher-highs and higher-lows, you certainly cannot bet against this market (certainly no Sell in May). In the Seasonal Advantage Portfolio (which continues to set new high watermarks) that we manage for clients at CastleMoore, we have been busy moving around in recent sessions, not by selling out of the market, but rather rotating within in it, seeking to lower our sensitivity to the market fluctuations now that benchmarks have become stretched to a significant (unsustainable) degree. The conflict in Iran remains a wildcard and some of the cues that we have been following that would warrant moving towards a more defensive posture in risk assets continue to trigger. Subscribers can view the themes in our chart books to either Accumulate or Avoid that we continue to gear portfolios towards.
Today, in our Market Outlook to subscribers, we discuss the following:
- The loss of a key supporting influence to equity market performance in the past month
- Looking ahead to the end-of-quarter rebalance phase in the market
- US Retail Sales and the Consumer Discretionary sector
- Weekly Jobless Claims and the health of the labor market
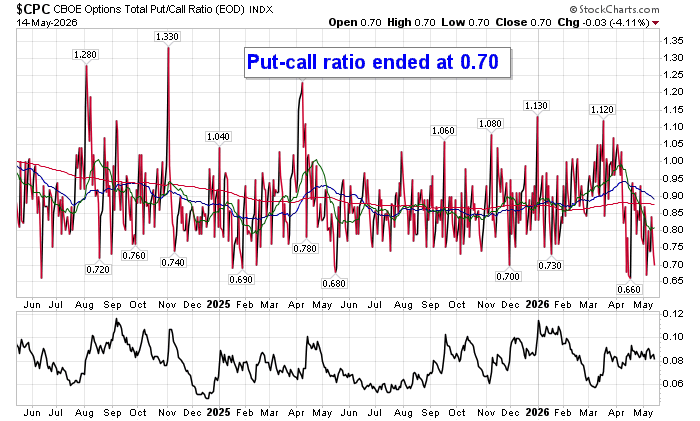
- Yet another low put-call ratio
Subscribers can look for this report in their inbox or by clicking on the following link and logging in: Market Outlook for May 15
Not signed up yet? Subscribe now to receive full access to all of the research and analysis that we publish
Sentiment on Thursday, as gauged by the put-call ratio, ended bullish at 0.70.
Seasonal charts of companies reporting earnings today:


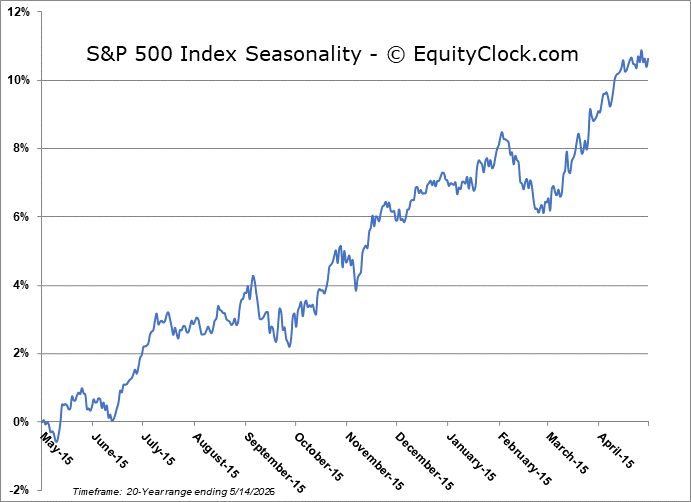
S&P 500 Index
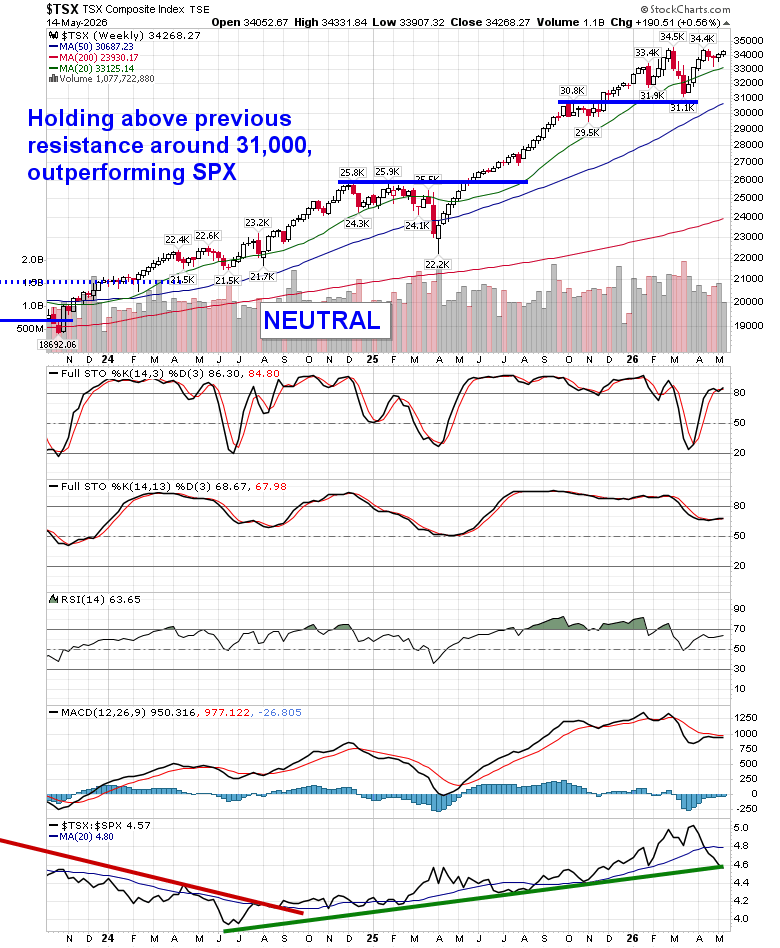
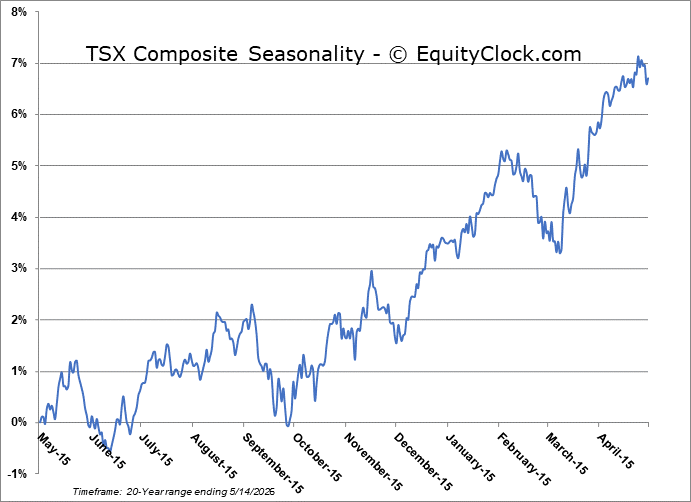
TSE Composite
| Sponsored By... |

|


