Stock Market Outlook for June 1, 2026

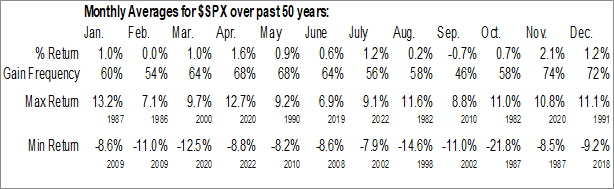
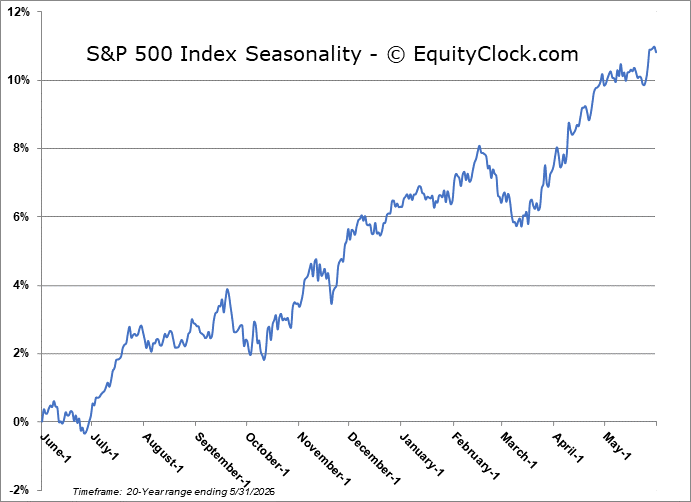
The S&P 500 Index has averaged a return of 0.6% in the month of June with a gain frequency of 64%.
*** Stocks highlighted are for information purposes only and should not be considered as advice to purchase or to sell mentioned securities. As always, the use of technical and fundamental analysis is encouraged in order to fine tune entry and exit points to average seasonal trends.
Stocks Entering Period of Seasonal Strength Today:
Subscribers Click on the relevant link to view the full profile. Not a subscriber? Signup here.
Stock Highlight: |
|

Gilead Sciences, Inc. (NASD:GILD) Seasonal Chart |
|

Duke Energy Corp. (NYSE:DUK) Seasonal Chart

American Elec Pwr Co., Inc. (NASD:AEP) Seasonal Chart
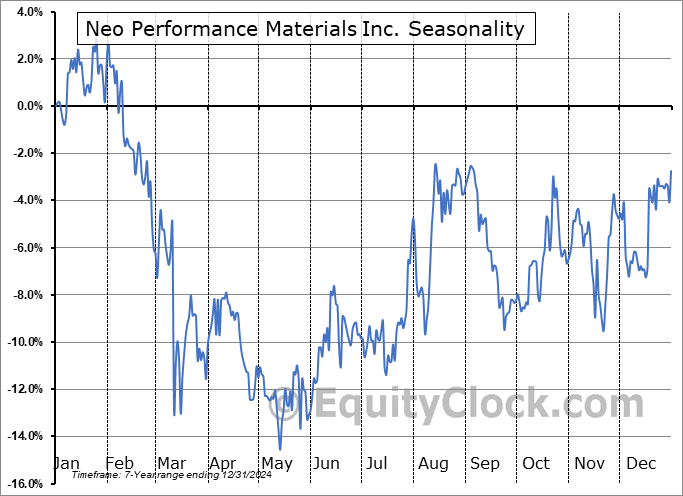
Neo Performance Materials Inc. (TSE:NEO.TO) Seasonal Chart

ConnectOne Bancorp Inc. (NASD:CNOB) Seasonal Chart

Jazz Pharmaceuticals, Inc. (NASD:JAZZ) Seasonal Chart

Movado Group, Inc. (NYSE:MOV) Seasonal Chart

Invesco High Yield Equity Dividend Achievers ETF (NASD:PEY) Seasonal Chart

iShares Expanded Tech-Software Sector ETF (NYSE:IGV) Seasonal Chart
Disclaimer: Comments and opinions offered in this report are for information only. They should not be considered as advice to purchase or to sell mentioned securities. Data offered is believed to be accurate, but is not guaranteed.
The Markets
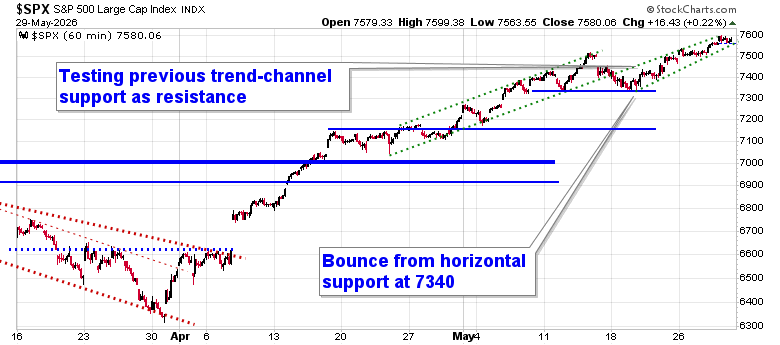
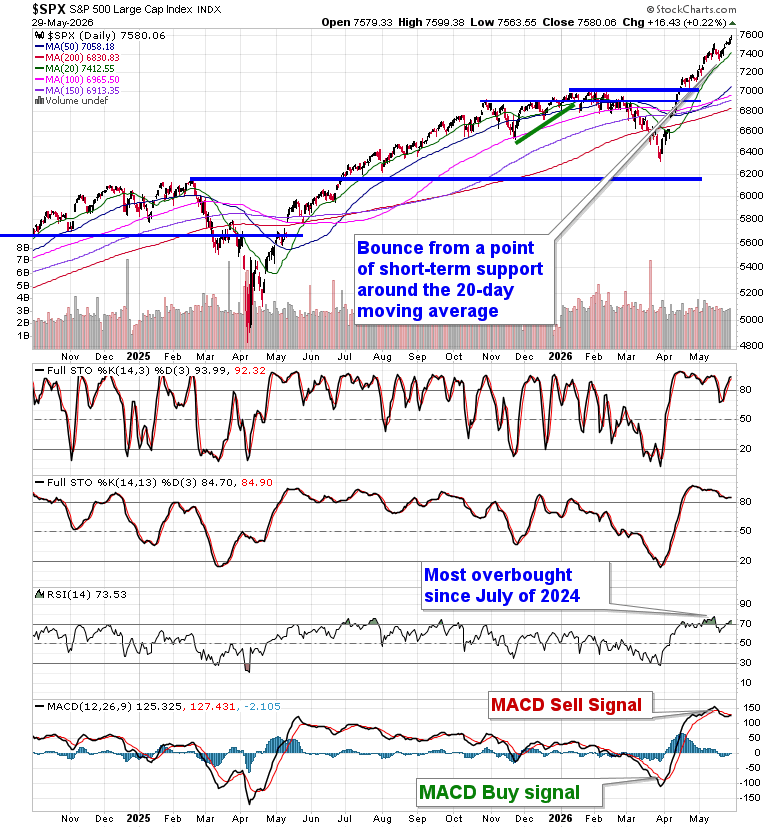
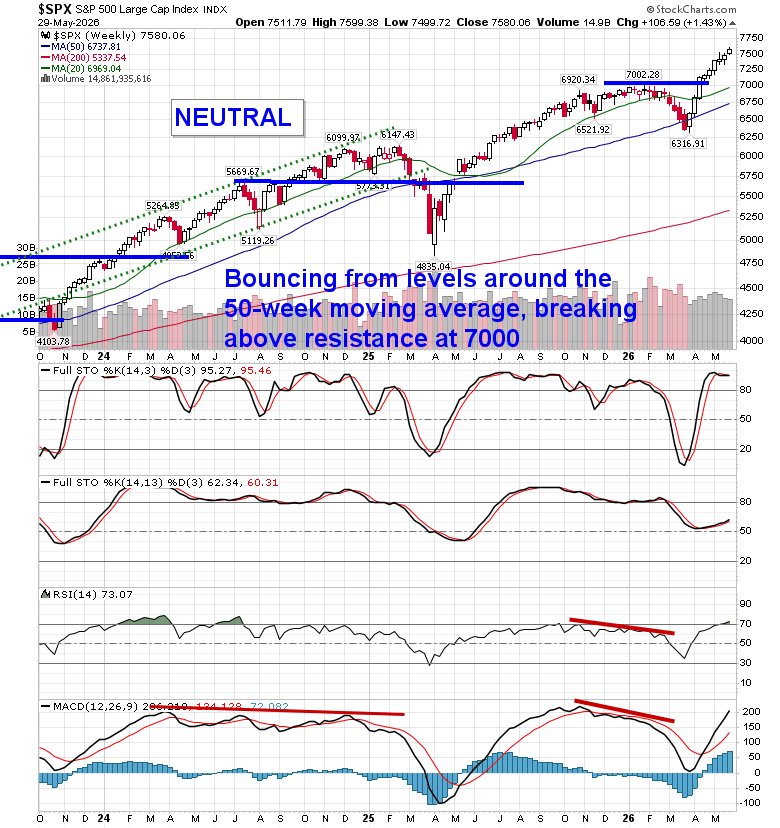
Another push into the technology sector while just about everything else faltered was sufficient to add another few points to broad equity market benchmarks to close out the final session of May. The S&P 500 Index ended up by two-tenths of one percent, continuing this grind higher below previous rising trendline support that elevated the large-cap benchmark in the first half of May. The benchmark has developed a new, tighter, rising span that doesn’t really seem to have much momentum/range behind it, but it is benefiting from the FOMO (fear of missing out) trade as investors chase performance. The lack of volume in the market since the March lows suggests that investors have been locked out of the market, conducive to this incremental grind higher. While the character of the market remains where levels of resistance hold less weight than levels of support, there are certainly fractures around the periphery as breadth in the market narrows. Overbought readings are beginning to flash again as the Relative Strength Index (RSI) moves back above 70. In the Seasonal Advantage Portfolio that we manage for clients at CastleMoore, we continue to hit new high watermarks and we have prepared for a more volatile/risk-off market framework (which admittedly has dampened our performance in the tech-led euphoria of recent days). The conflict/deal in Iran is the ongoing wildcard and the cues that we have been following that warranted moving towards a more defensive posture in risk assets have not gone away (although our thesis surrounding them is being strained as levels of support for yields and oil are being pressured). Subscribers can view the themes in our chart books to either Accumulate or Avoid that we continue to gear portfolios towards.
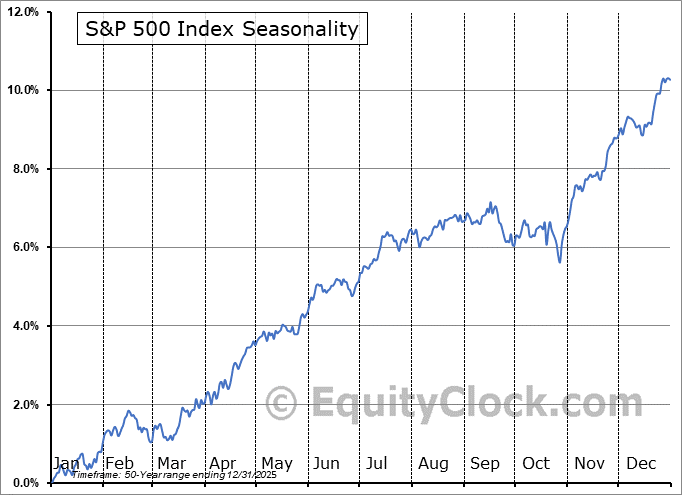
Looking ahead, seasonally, the month of June has been a rather lacklustre period for equity performance as markets suffer from end-of-month, end-of-quarter, and end of the first half of the year rebalancing. In a typical year, this suggests mean reversion of the strength that is typical between January and May, leading to a drift lower in prices into the start of summer. Therefore, the stocks that have performed the best quarter-to-date and half-to-date are likely to realize selling pressures as portfolio managers rebalance to areas where they are underweight. Investors are encouraged to be mindful of this rebalancing as your winners can become vulnerabe to profit-taking, while your laggards will see their best chance of playing catch-up (to a certain degree). Some of this can already be seen with the pronounced move in Software stocks (IGV) – an Accumulate candidate – in recent weeks. Investors can benefit by looking for opportinities in the year-to-date laggards, which, at the time of writing, are dominated by the health care, utilities, financial, and communication services sectors; technology, broadly, is the obvious sector that is vulnerable to rebalancing pressures given how parabolic the sector has grown out of its March bottom. This rebalance period leads into the notorious summer rally period between June 27th and July 17th, on average, which brings in a strong tide that tends to lift all boats.
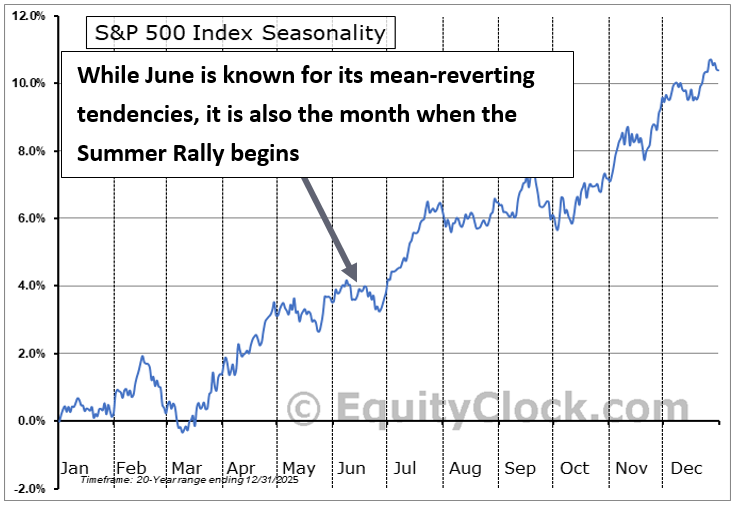
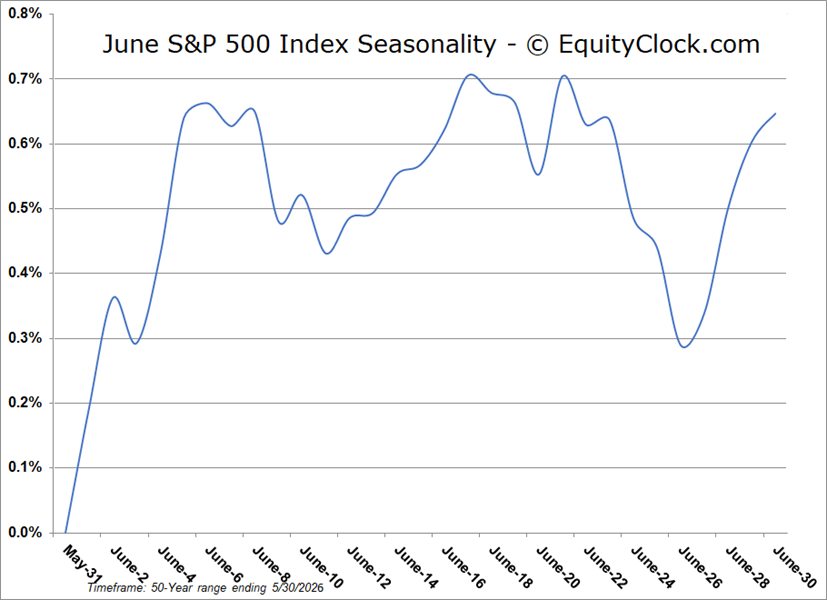
Over the past five decades, the S&P 500 Index has averaged a return of 0.6% in the sixth month of the year with a gain frequency of 64%. Returns have ranged from a loss of 8.6% in June of 2008 to a gain of 6.9% in June of 2019. The average pattern for the month, based on this five decade timeframe, shows that stocks tend to hold up into the middle of the month followed by short-term weakness during the third and fourth weeks of June. A few sessions before the month of June comes to a close, the summer rally period begins as investors pick up the names that have been sold off the most during this portfolio rebalance period. The summer rally traditionally lasts for three weeks, running through the middle of July as new funds are put to work and investors prepare for earnings season ahead.
Just Released…
Our monthly report for June is out, providing you with everything that you need to know to navigate the market through the month(s) ahead.
Highlights in this report include:
- Equity market tendencies in the month of June
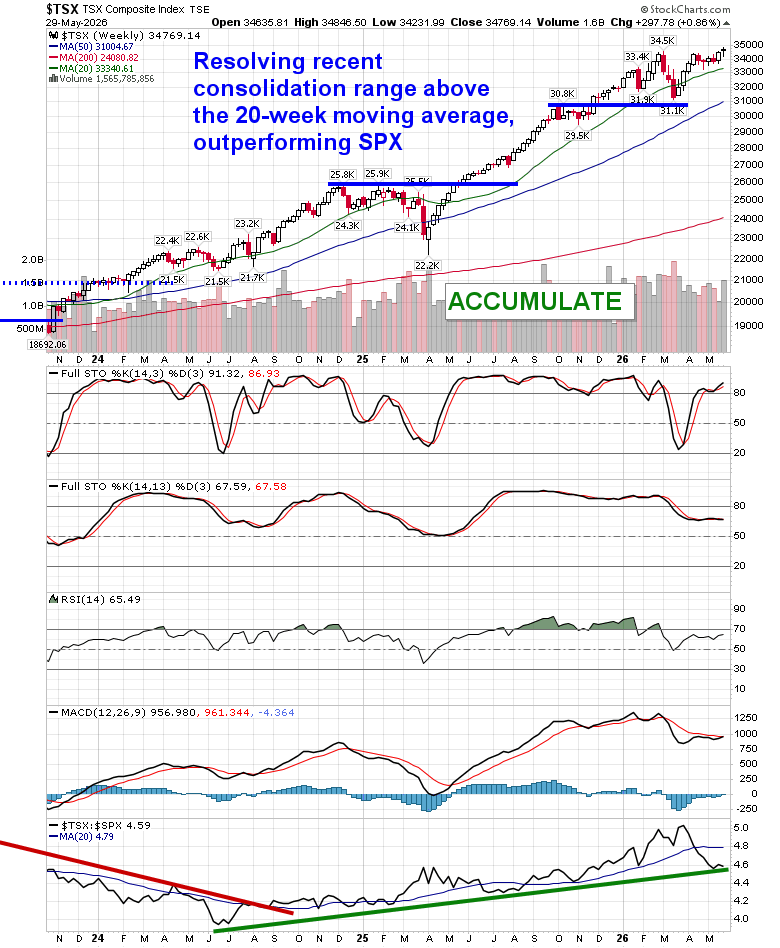
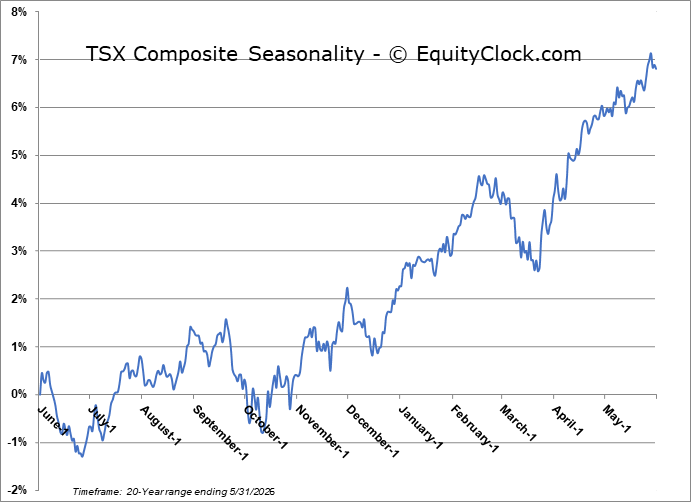
- Canada perking up, gearing up to resume its long-term path of outperformance
- Digging into Canadian equities
- Risk Aversion kicking in
- AI and Defense driving Industrial Production
- Dollar and rate headwinds
- Consumer under strain heading into summer driving season
- Bifurcation in the Materials sector
- Mean reversion month
- The first of the weakest two-week spans of the year in the equity market
- Lack of Volume
- Our list of all segments of the market to either Accumulate or Avoid, along with relevant ETFs
- Positioning for the months ahead
- Sector Reviews and Ratings
- Stocks that have Frequently Gained in the Month of June
- Notable Stocks and ETFs Entering their Period of Strength in June
Subscribers can look for this 91-page report in their inbox and in the report archive.
Not signed up yet? Subscribe now to receive full access to all of the research and analysis that we publish
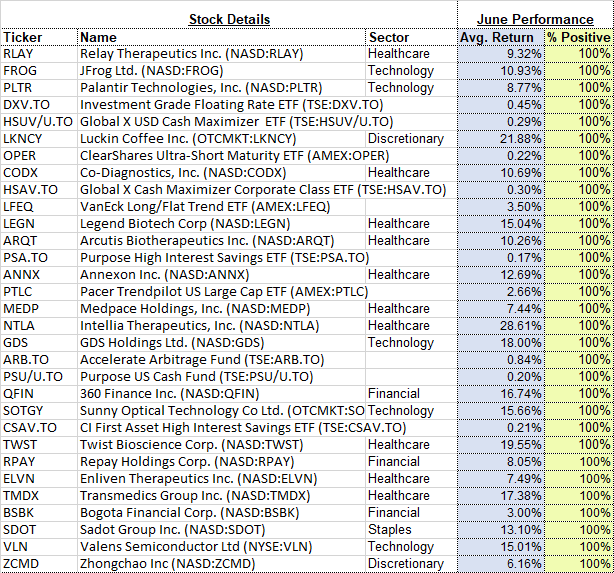
With the new month upon us and as we celebrate the release of our monthly report for June, today we release our screen of all of the stocks that have gained in every June over their trading history. While we at Equity Clock focus on a three-pronged approach (seasonal, technical, and fundamental analysis) to gain exposure to areas of the market that typically perform well over intermediate (2 to 6 months) timeframes, we know that stocks that have a 100% frequency of success for a particular month is generally of interest to those pursuing a seasonal investment strategy. Below are the results:
And how about those securities that have never gained in this sixth month of the year, here they are:
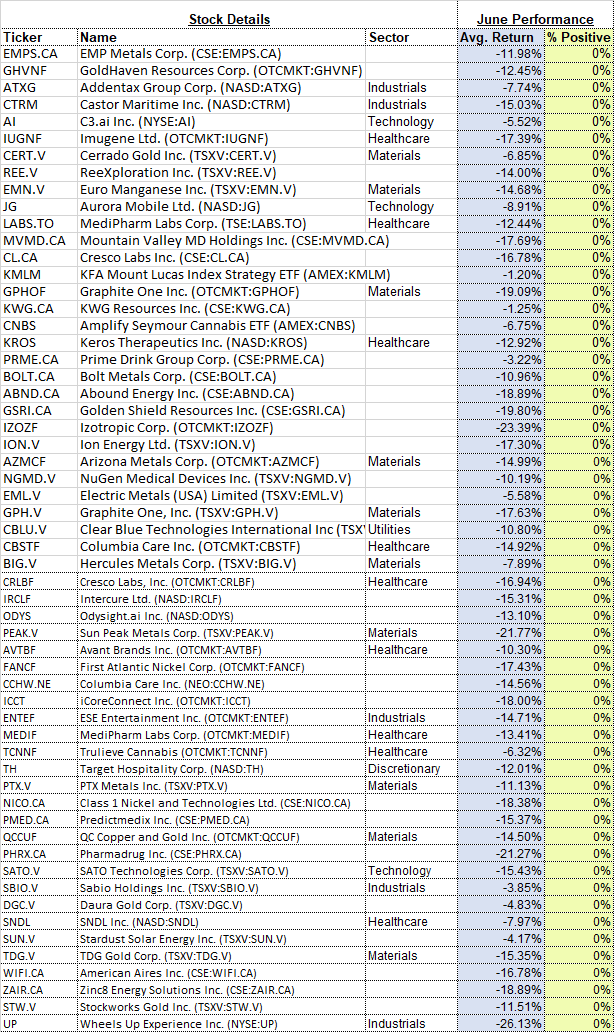
*Note: None of the results highlighted above have the 20 years of data that we like to see in order to accurately gauge the annual recurring, seasonal influences impacting an investment, therefore the reliability of the results should be questioned. We present the above list as an example of how our downloadable spreadsheet available to yearly subscribers can be filtered. For a more extensive list of high frequency (70% ) gainers for the month of June, please refer to our monthly report.
Today, in our Market Outlook to subscribers, we discuss the following:
- Monthly look at the large-cap benchmark
- June tendencies for stocks
- Canadian Gross Domestic Product (GDP) and the investment implications within (Canadian stocks)
- The energy sector
- Investor sentiment
Subscribers can look for this report in their inbox or by clicking on the following link and logging in: Market Outlook for June 1
Not signed up yet? Subscribe now to receive full access to all of the research and analysis that we publish
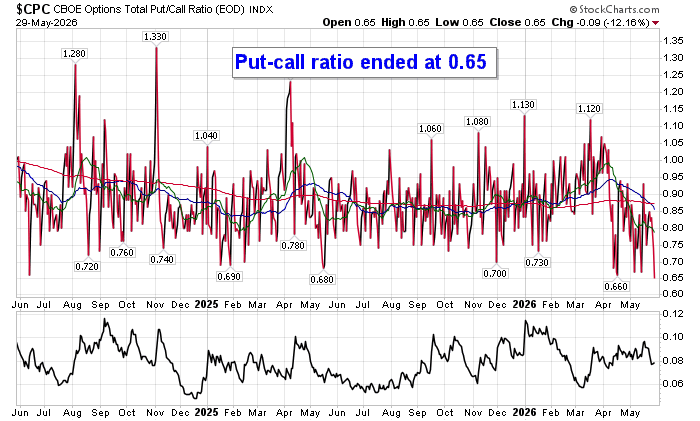
Sentiment on Friday, as gauged by the put-call ratio, ended overly bullish at 0.65.
Seasonal charts of companies reporting earnings today: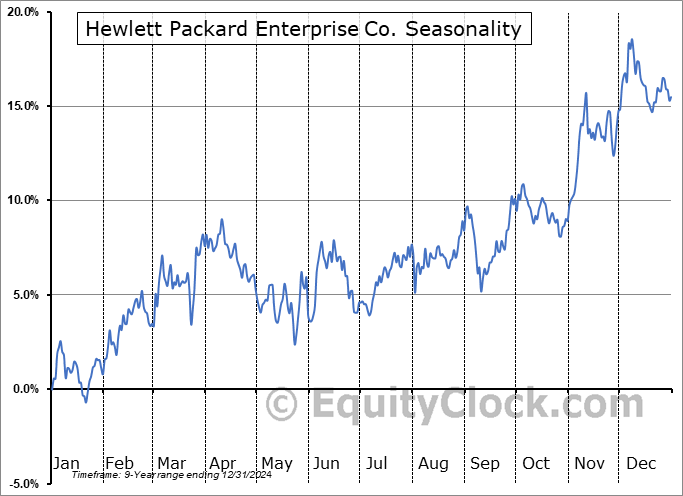


S&P 500 Index
TSE Composite
| Sponsored By... |

|


