Stock Market Outlook for July 10, 2026

A supply-demand mismatch in the housing market threatens the value of homes in the back half of the year.
*** Stocks highlighted are for information purposes only and should not be considered as advice to purchase or to sell mentioned securities. As always, the use of technical and fundamental analysis is encouraged in order to fine tune entry and exit points to average seasonal trends.
Stocks Entering Period of Seasonal Strength Today:
Subscribers Click on the relevant link to view the full profile. Not a subscriber? Signup here.
Stock Highlight: |
|

Vanguard Growth ETF Portfolio (TSE:VGRO.TO) Seasonal Chart |
|

Cambria Value and Momentum ETF (AMEX:VAMO) Seasonal Chart

iShares Core Growth ETF Portfolio (TSE:XGRO.TO) Seasonal Chart

PCB Bancorp (NASD:PCB) Seasonal Chart

Fidelity Low Volatility Factor ETF (AMEX:FDLO) Seasonal Chart

Vanguard U.S. Multifactor ETF (AMEX:VFMF) Seasonal Chart

Vanguard US Quality Factor ETF (AMEX:VFQY) Seasonal Chart

Global Payments, Inc. (NYSE:GPN) Seasonal Chart

Capital Power Corp. (TSE:CPX.TO) Seasonal Chart

CI First Asset Health Care Giants Covered Call ETF (TSE:FHI.TO) Seasonal Chart
Disclaimer: Comments and opinions offered in this report are for information only. They should not be considered as advice to purchase or to sell mentioned securities. Data offered is believed to be accurate, but is not guaranteed.
The Markets
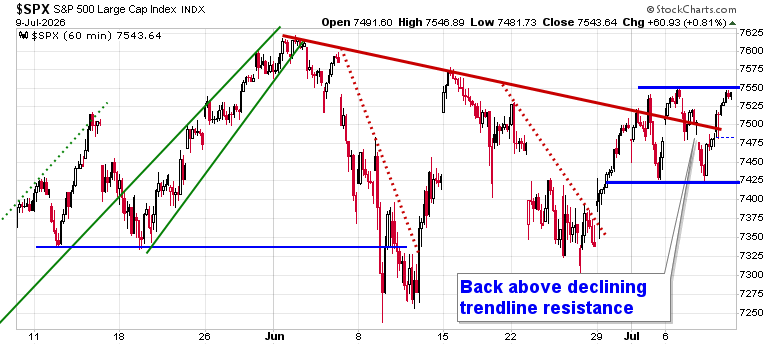
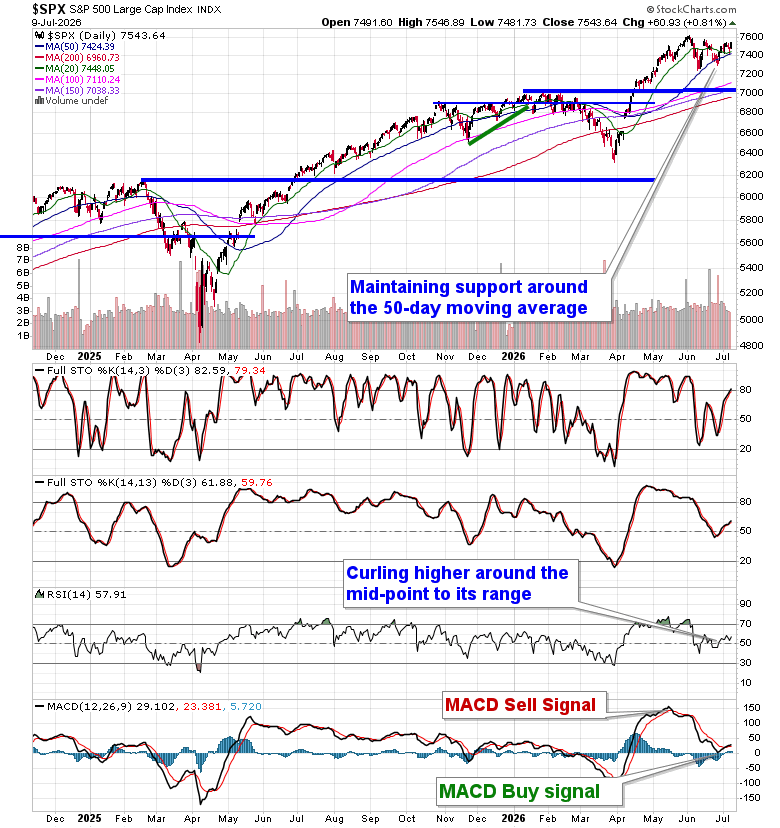
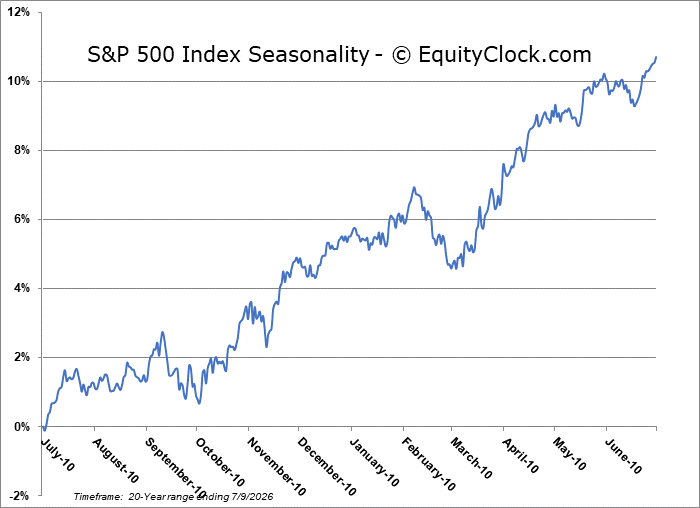
Stocks snapped back from Wednesday’s decline as investors returned to AI infrastructure plays amidst the enticing tailwinds that they are benefiting from. The S&P 500 Index gained just over eight-tenths of one percent, moving back above declining trendline resistance from the month of June. The gap around 7480 that has been providing an important pivot point for investors in recent days has been exceeded; the market is expected to be bearish if below this hurdle, bullish if above. Support on the daily chart is being maintained at 20 and 50-day moving averages (~7425), which have converged on one another in a bearish manner. Daily momentum indicators have curled higher in recent days, triggering near-term buy signals that still align nicely with the start of the summer rally phase; MACD crossed above its signal line in what is a fresh buy signal following the sell trigger that was recorded in the middle of May. In the Seasonal Advantage Portfolio that we manage for clients at CastleMoore, we remain positioned for this summer rally phase that began on June 27th (S&P 500 Index is strongly higher, above the seasonal norm, since that point). Following a first half performance in the Seasonal Advantage Portfolio that was well ahead of our own benchmark (as well as all major equity benchmarks in the market), we are still anticipating strength for the start of the second half of the year, but we are scrutinizing the risks accordingly that have abruptly escalated with the increase in geopolitical tensions. The start of earnings season provides some cover to the headline threats. Subscribers can view what we are targeting in our list of market segments to either Accumulate or Avoid.
Today, in our Market Outlook to subscribers, we discuss the following:
- Semiconductor stocks
- Housing Market Concerns
- Labor Market Warning Signs Continue
- Portfolio Positioning Takeaways
Subscribers can look for this report in their inbox or by clicking on the following link and logging in: Market Outlook for July 10
Not signed up yet? Subscribe now to receive full access to all of the research and analysis that we publish
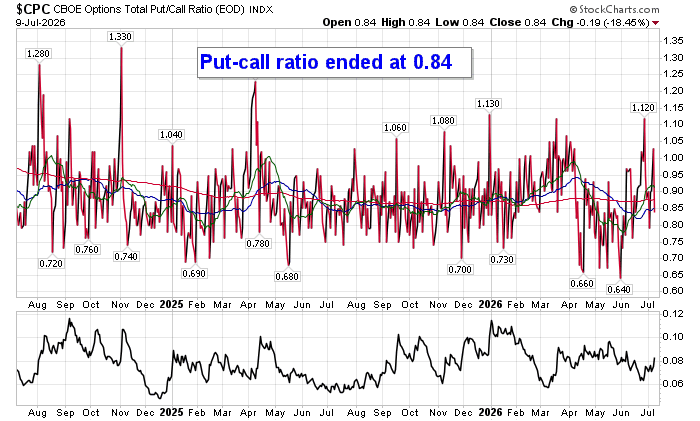
Sentiment on Thursday, as gauged by the put-call ratio, ended bullish at 0.84.
Seasonal charts of companies reporting earnings today:
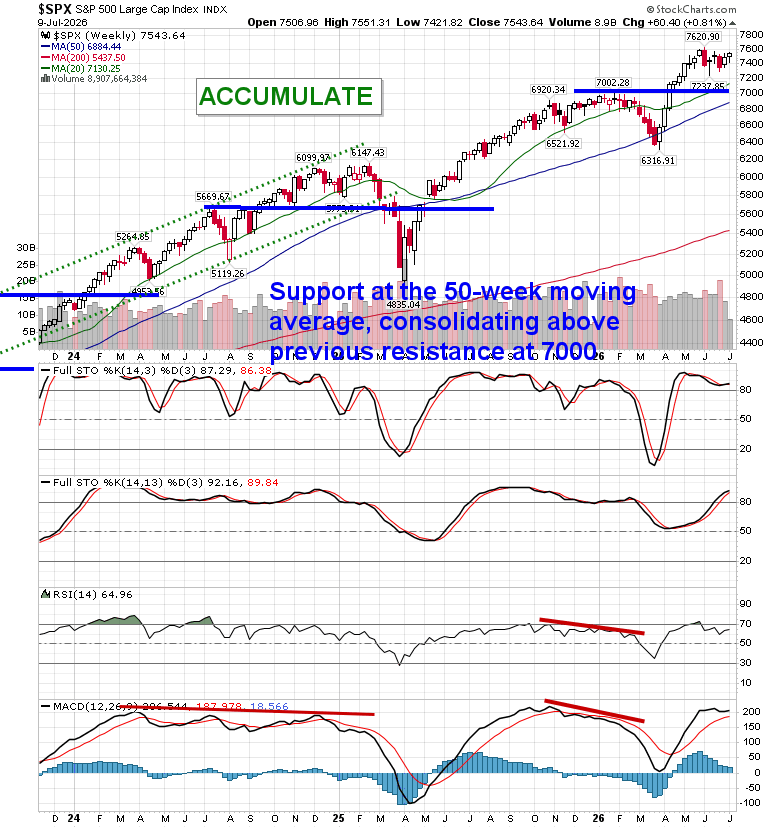
S&P 500 Index
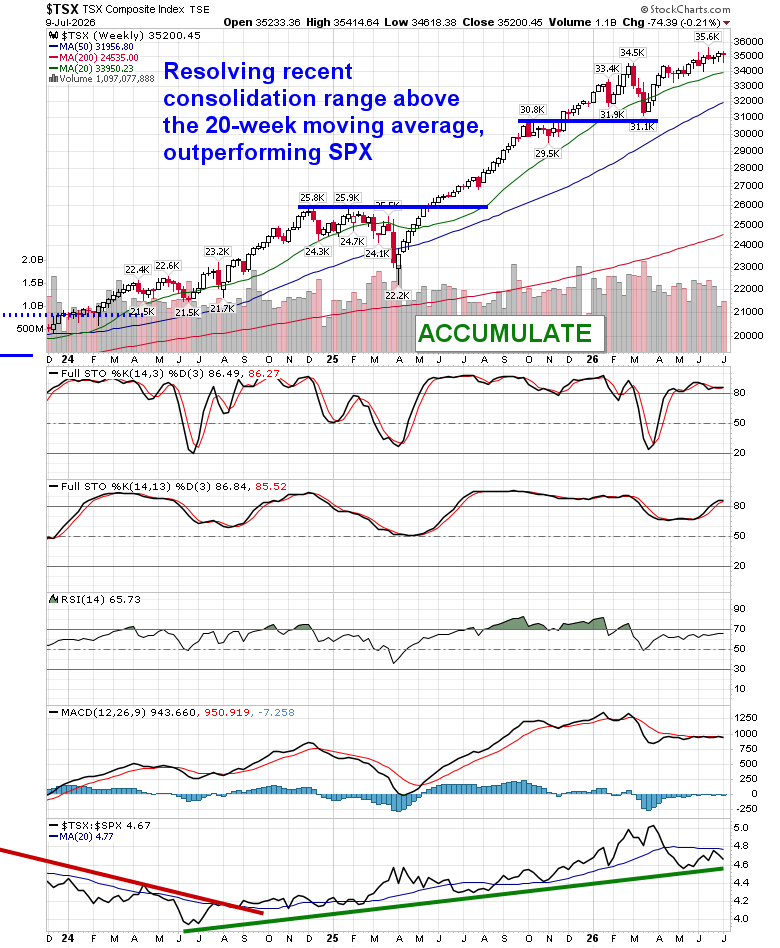
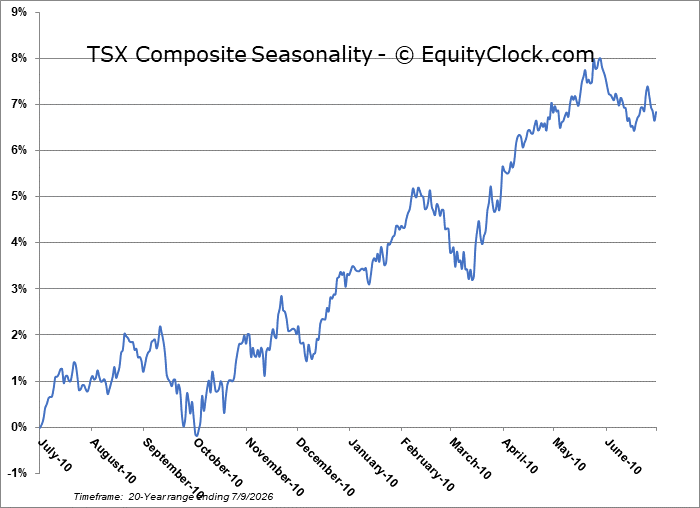
TSE Composite
| Sponsored By... |

|


