Stock Market Outlook for August 31, 2026

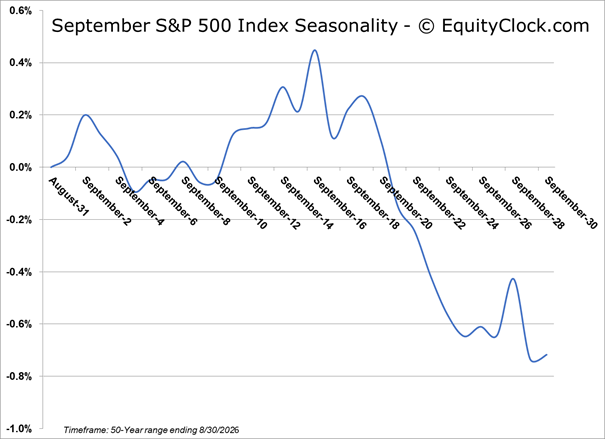
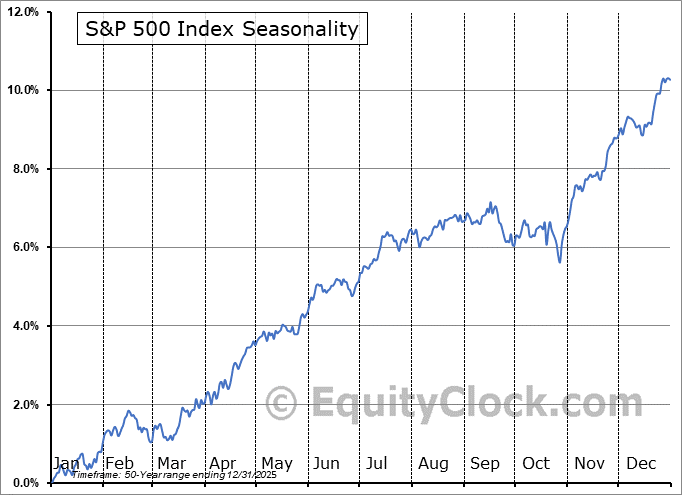
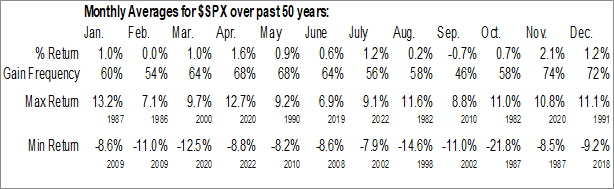
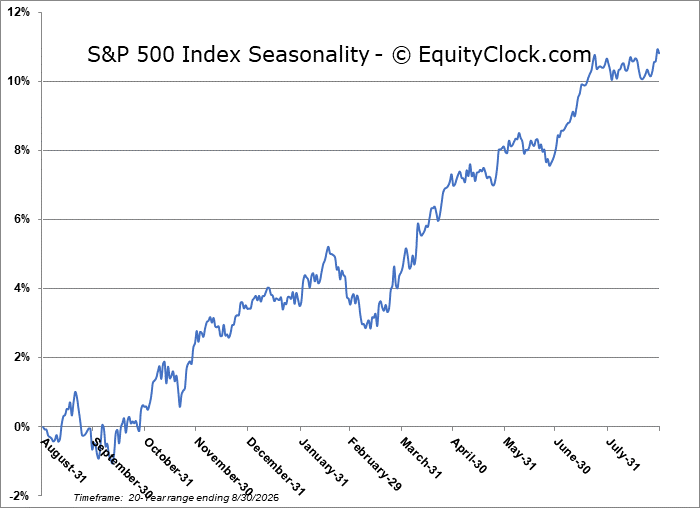
The S&P 500 Index has lost 0.7%, on average, in September during the past 50-years with a frequency of gains for the month at a mere 46%.
*** Stocks highlighted are for information purposes only and should not be considered as advice to purchase or to sell mentioned securities. As always, the use of technical and fundamental analysis is encouraged in order to fine tune entry and exit points to average seasonal trends.
Stocks Entering Period of Seasonal Strength Today:
Subscribers Click on the relevant link to view the full profile. Not a subscriber? Signup here.

Aimia Inc. (TSE:AIM.TO) Seasonal Chart

Aegon NV (NYSE:AEG) Seasonal Chart

Usio Inc. (NASD:USIO) Seasonal Chart

Vanguard Dividend Appreciation ETF (NYSE:VIG) Seasonal Chart
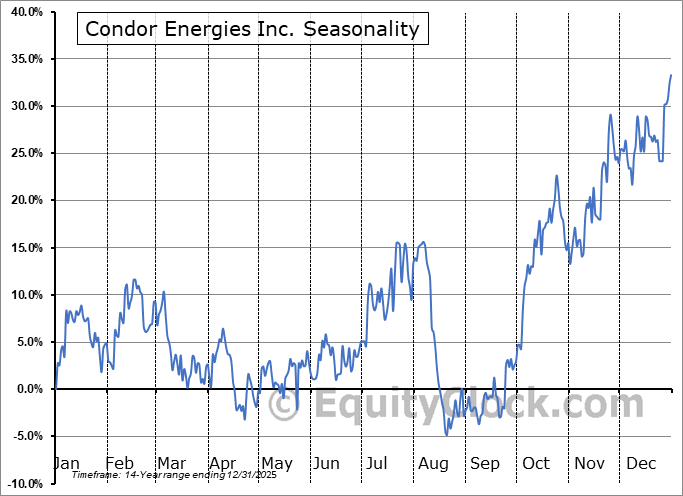
Condor Energies Inc. (TSE:CDR.TO) Seasonal Chart

Metlife, Inc. (NYSE:MET) Seasonal Chart

iShares China Large-Cap ETF (NYSE:FXI) Seasonal Chart

Vanguard Global Value Factor ETF (TSE:VVL.TO) Seasonal Chart

Parex Resources Inc. (TSE:PXT.TO) Seasonal Chart
Disclaimer: Comments and opinions offered in this report are for information only. They should not be considered as advice to purchase or to sell mentioned securities. Data offered is believed to be accurate, but is not guaranteed.
The Markets
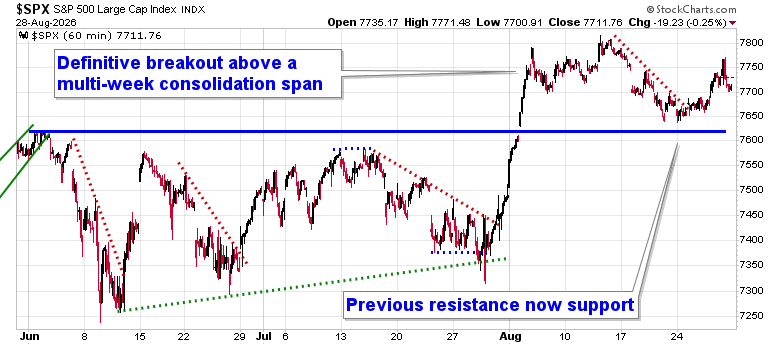
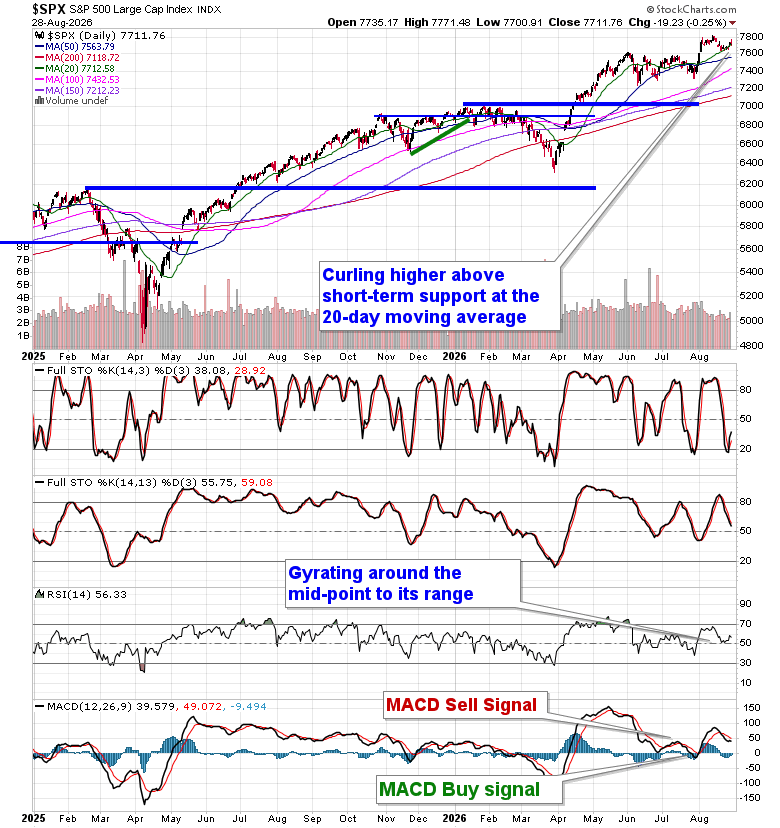
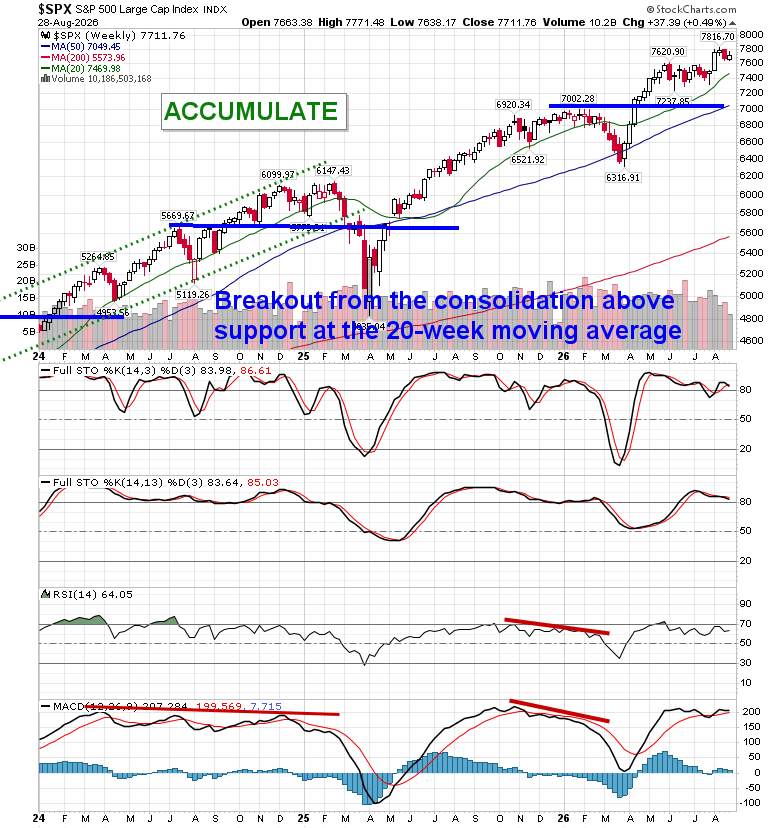
A spike in short-term lending rates given the perception of a more hawkish Fed following comments from Kevin Warsh at Jackson Hole had stocks under strain on Friday. The S&P 500 Index shed a quarter of one percent, still holding above the upper limit of the prior consolidation span between 7250 and 7620 that the benchmark broke out from at the start of August. A short-term bull-flag pattern continues to be charted, suggesting further upside to be expected. The benchmark can be seen curling higher from short-term support at its 20-day moving average (7712), keeping the ball in the bulls court heading towards the month of September. The market is showing a lot of respect to levels of support, warranting a bullish tilt heading into what is often a volatile period for equity performance in the month of September. Daily momentum indicators have started to curl higher around their middle lines, retaining characteristics of a bullish trend. In the Seasonal Advantage Portfolio that we manage for clients at CastleMoore, we continue to hold an elevated exposure to stocks, aligning with the optimism that the manufacturing economy is expressing. The period of volatility in the equity market through the weeks ahead could start to impose some erratic results, but there is some leeway on the calendar before the peak period of weakness rolls around starting in the middle of September. Subscribers can view what we are targeting in our list of market segments to either Accumulate or Avoid.
Monday is the final trading day of August and we are focusing our sights on the prospects for the market in the month ahead. September is the weakest month of the year for equity market returns and understanding the seasonal norms is important. The S&P 500 Index has lost 0.7%, on average, in this last month of the third quarter over the past 50 years. The frequency of gains for the month is a mere 46%. Returns have ranged from a loss of 11.0% in September of 2002 to a gain of 8.8% in September of 2010. We break down everything to look out for and how to position in our just released monthly report for September.
Just Released…
Our monthly report for September is out, providing you with everything that you need to know to navigate the market through the month(s) ahead.
Highlights in this report include:
- Equity market tendencies in the month of September
- Volatility Index
- Danger zone for stocks
- Technology Valuations Converging on that of the Market
- Manufacturer sentiment the strongest for this time of year on record
- Gold
- Miners outperforming the precious metal
- Energy supported into the Fall
- Weak supply of energy and weak demand, as well
- Bond Market Stagnancy
- Natural Gas
- Investor sentiment not at an extreme to hint of a turning point in the market
- The second of the weakest two-week spans in the equity market
- Our list of all segments of the market to either Accumulate or Avoid, along with relevant ETFs
- Positioning for the months ahead
- Sector Reviews and Ratings
- Stocks that have Frequently Gained in the Month of September
- Notable Stocks and ETFs Entering their Period of Strength in September
Subscribers can look for this 100-page report in their inbox and in the report archive.
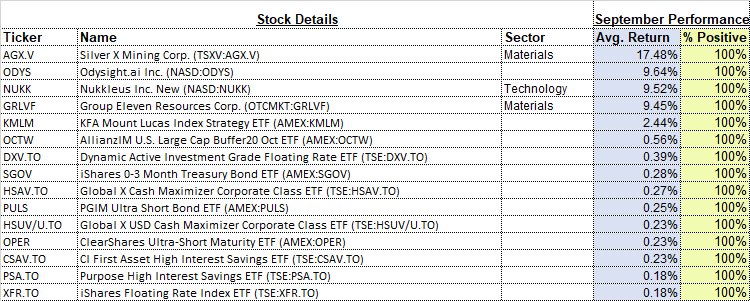
With the new month upon us and as we celebrate the release of our monthly report for September, today we release our screen of all of the stocks that have gained in every September over their trading history. While we at Equity Clock focus on a three-pronged approach (seasonal, technical, and fundamental analysis) to gain exposure to areas of the market that typically perform well over intermediate (2 to 6 months) timeframes, we know that stocks that have a 100% frequency of success for a particular month is generally of interest to those pursuing a seasonal investment strategy. Below are the results:
And how about those securities that have never gained in this ninth month of the year, here they are:
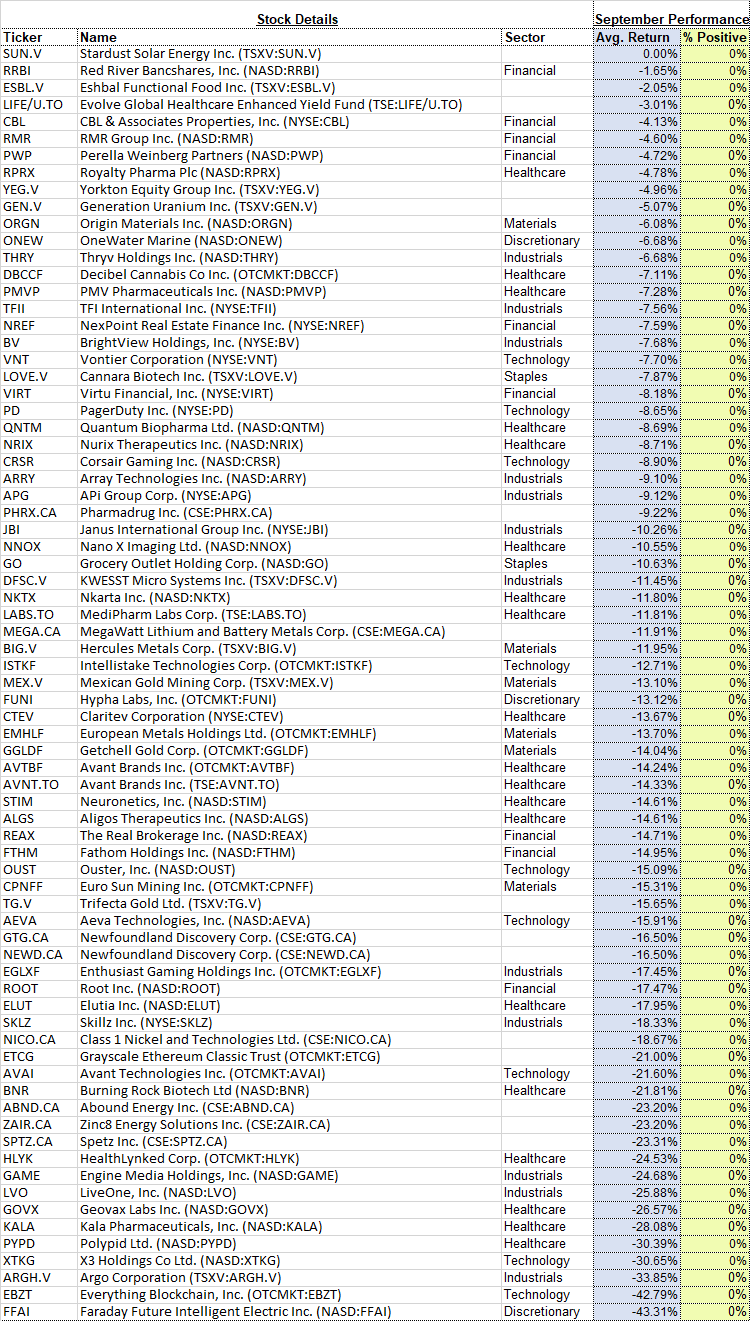
*Note: None of the results highlighted above have the 20 years of data that we like to see in order to accurately gauge the annual recurring, seasonal influences impacting an investment, therefore the reliability of the results should be questioned. We present the above list as an example of how our downloadable spreadsheet available to yearly subscribers can be filtered. For a more extensive list of high frequency (70% ) gainers for the month of September, please refer to our monthly report.
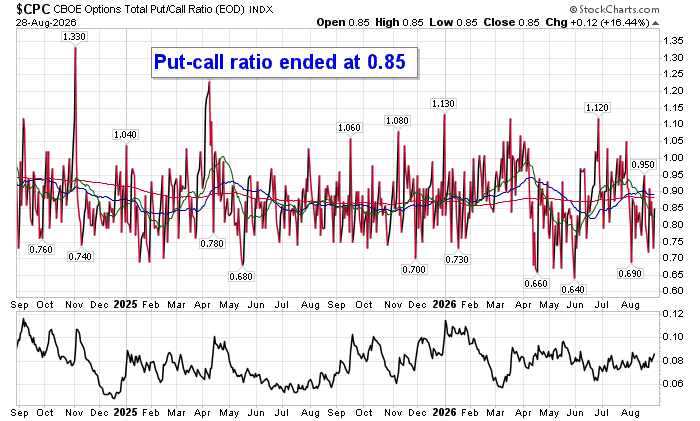
Sentiment on Friday, as gauged by the put-call ratio, ended bullish at 0.85.
Seasonal charts of companies reporting earnings today:


S&P 500 Index
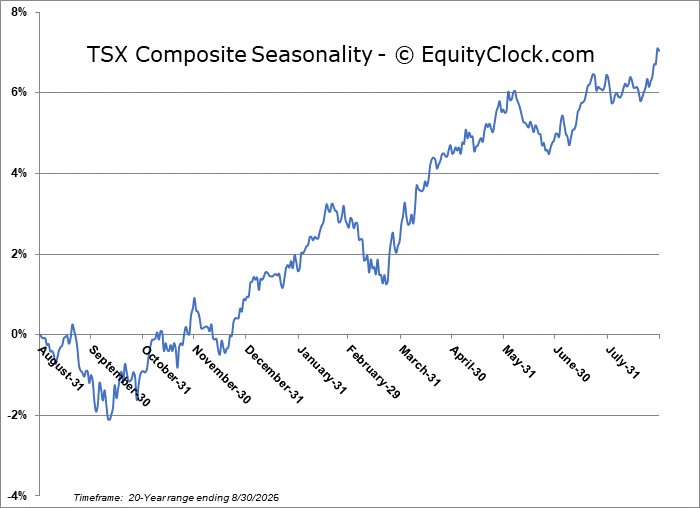
TSE Composite
| Sponsored By... |

|


