Stock Market Outlook for October 23, 2026

Two phantom weights remain heavy on the market: Concerns about AI debt and the mid-term election outcome. We’ll show you what we are doing (or have done) about it.
*** Stocks highlighted are for information purposes only and should not be considered as advice to purchase or to sell mentioned securities. As always, the use of technical and fundamental analysis is encouraged in order to fine tune entry and exit points to average seasonal trends.
Stocks Entering Period of Seasonal Strength Today:
Subscribers Click on the relevant link to view the full profile. Not a subscriber? Signup here.

Vanguard S&P Mid-Cap 400 Growth ETF (NYSE:IVOG) Seasonal Chart

Vanguard Materials ETF (NYSE:VAW) Seasonal Chart

SPDR S&P Semiconductor ETF (NYSE:XSD) Seasonal Chart

CONMED Corp. (NYSE:CNMD) Seasonal Chart

Charles Schwab Corp. (NYSE:SCHW) Seasonal Chart

Vulcan Materials Co. (NYSE:VMC) Seasonal Chart

Reliance Steel & Aluminum (NYSE:RS) Seasonal Chart

Urban Outfitters, Inc. (NASD:URBN) Seasonal Chart

KLA Corp. (NASD:KLAC) Seasonal Chart

Winnebago Industries Inc. (NYSE:WGO) Seasonal Chart
Disclaimer: Comments and opinions offered in this report are for information only. They should not be considered as advice to purchase or to sell mentioned securities. Data offered is believed to be accurate, but is not guaranteed.
The Markets
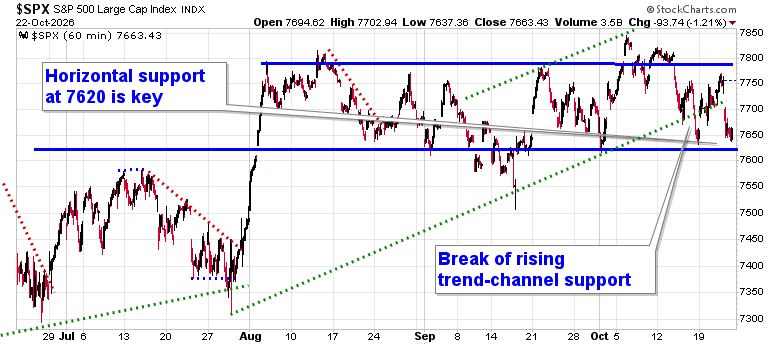
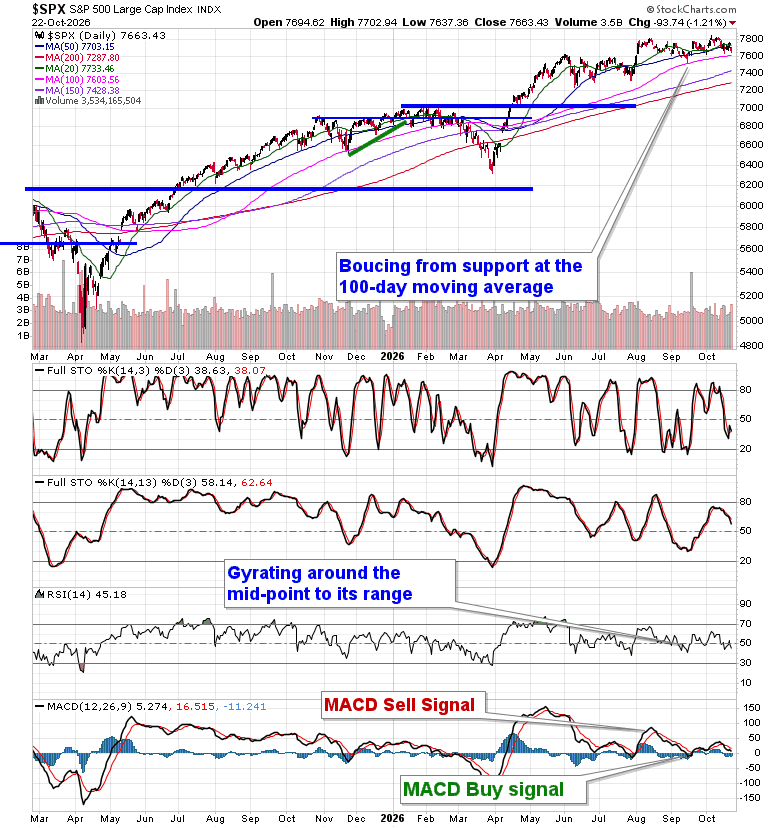
Renewed concerns pertaining to the debt that the hyperscalers have taken on buildout AI infrastructure had traders once again exiting technology exposure. The Tech-heavy S&P 500 Index fell by 1.21%, dropping back to the lower limit of the range that the benchmark has been in since August between 7620 and 7800. A head-and-shoulders pattern on the hourly chart can be picked out with the lower limit of the aforementioned span acting as the neckline. A breakdown would propose a downside target of 7400, or back to the July lows. The sloppiness of the tape in recent days and the concerns that the credit market is showing suggest that the probability of a breakdown is high. On Friday, the index broke below short-term rising trend channel support, turning off the path of higher-highs and higher-lows that had carried the benchmark in the past month. 20 and 50-day moving averages are being lost and the 100-day moving average is the last line of defense before a more substantial correction is achieved. Weakening support raises concerns for the health of stocks moving forward. The market has reached the time of year when volatility starts to peak and roll over through the last couple of months of the year, thereby promoting strength in stocks, but the breakout in the VIX on Friday above declining trendline resistance provides a sign that the instability that is leaching into the market may just be getting started. As noted in this week’s chart books, there are segments following last week’s price action that we no longer want to be exposed to, but the market has provided rotation opportunities that allow us to maintain our overall equity exposure. Members can stay on top of our thinking and what we are watching in our regular reports, as well as view what we are targeting in our list of market segments to either Accumulate or Avoid.
Today, in our Market Outlook to subscribers, we discuss the following:
- VIX confirming market instability and the simple way to use the fear gauge to time re-entry back into stocks
- Junk bond credit spreads
- Pressure against stocks ramping up as odds over the outcome of the mid-term election change
- Electrification stocks
- Breakdown in Gold and what we are doing about it
- Treasury yields testing an important zone of resistance as potential support
- Weekly Jobless Claims and the health of the labor market
- Investor sentiment surprisingly bullish amidst the selloff; what to be on the look out for ahead.
Subscribers can look for this report in their inbox or by clicking on the following link and logging in: Market Outlook for October 23
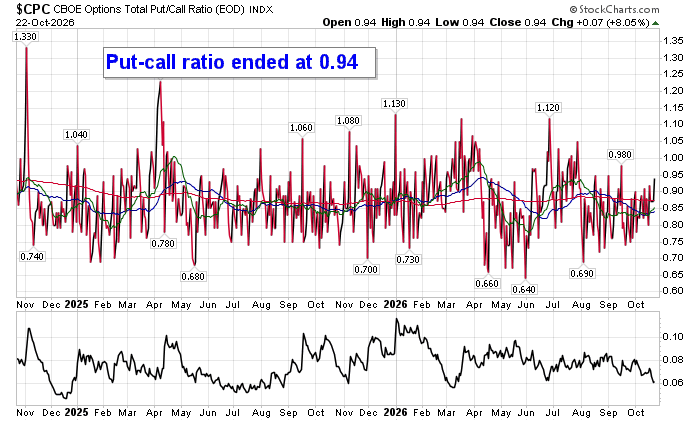
Sentiment on Thursday, according to the put-call ratio, surprisingly ended bullish at 0.94.
Seasonal charts of companies reporting earnings today:


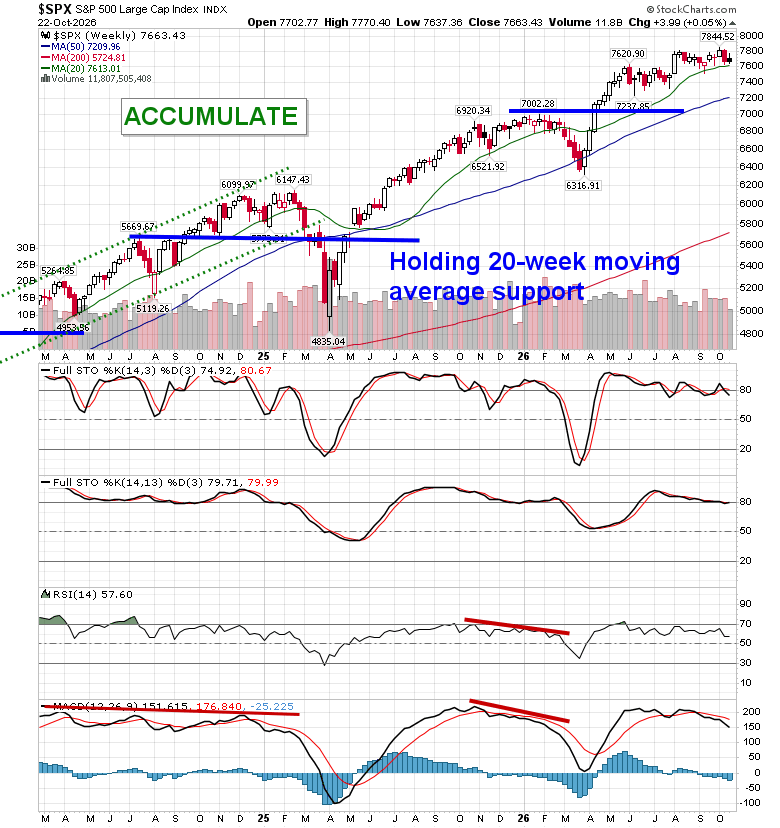
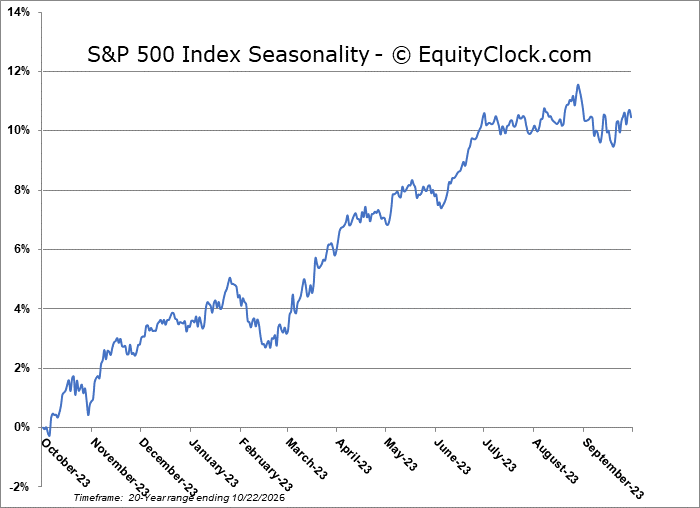
S&P 500 Index
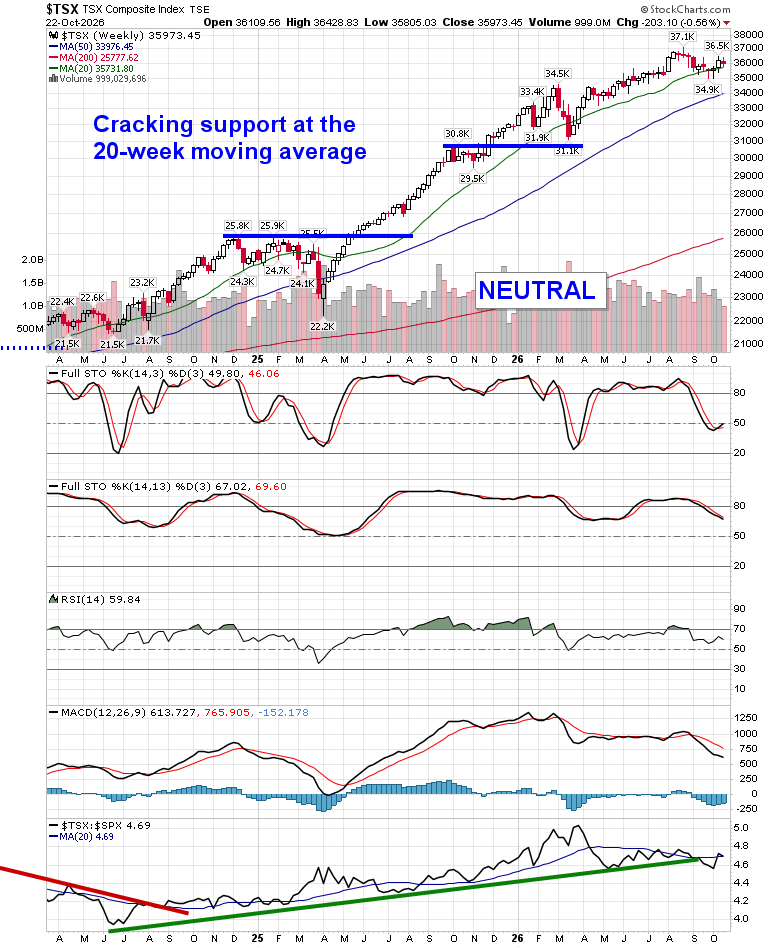
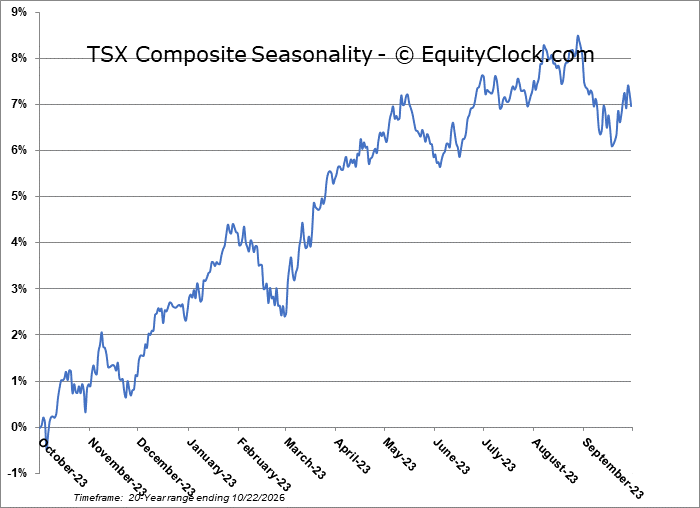
TSE Composite
| Sponsored By... |

|


