Stock Market Outlook for April 24, 2026

Short covering rally is over: Three segments to scrutinize whether the market can gain a more balanced footing from here or falter back towards the March lows.
*** Stocks highlighted are for information purposes only and should not be considered as advice to purchase or to sell mentioned securities. As always, the use of technical and fundamental analysis is encouraged in order to fine tune entry and exit points to average seasonal trends.
Stocks Entering Period of Seasonal Strength Today:
Subscribers Click on the relevant link to view the full profile. Not a subscriber? Signup here.
Stock Highlight: |
|

Bel Fuse, Inc. (NASD:BELFA) Seasonal Chart |
|

Comcast Corp. (NASD:CMCSA) Seasonal Chart

Carrier Global Corp. (NYSE:CARR) Seasonal Chart

SPDR S&P 1500 Momentum Tilt ETF (AMEX:MMTM) Seasonal Chart
Disclaimer: Comments and opinions offered in this report are for information only. They should not be considered as advice to purchase or to sell mentioned securities. Data offered is believed to be accurate, but is not guaranteed.
The Markets
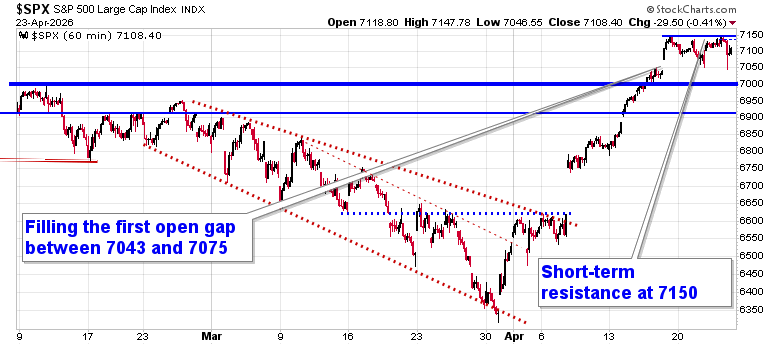
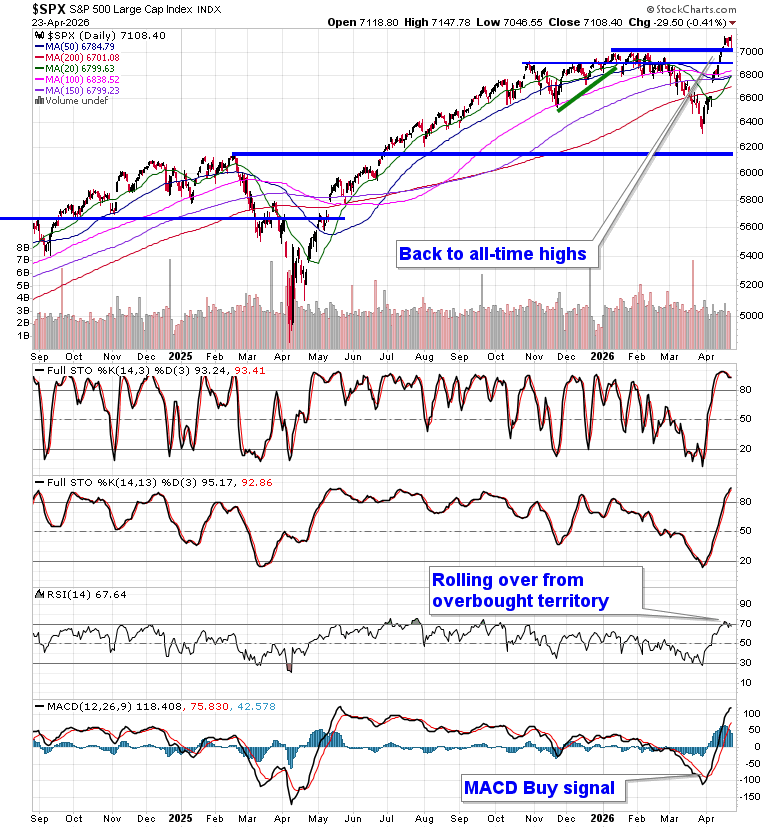
Stocks slipped on Thursday as uncertainty pertaining to the resolution of the conflict in Iran sent the price of Oil higher, elevating the cost of borrowing in the process. The S&P 500 Index ended lower by just over four-tenths of one percent, increasingly deriving a short-term cap around 7150. A number of gaps remain unfilled below, including the big one between 6620 and 6740, but, ultimately, the character of the market has changed where levels of resistance hold less weight than levels of support. A break below Friday’s gap support would open the door to the gap between 6885 and 6905 that was opened a week ago Tuesday. Momentum indicators have been rolling over from overbought territory, highlighting the upside exhaustion that we had been noting in recent days. In the Seasonal Advantage Portfolio (which is strongly higher YTD, continuing to set new high watermarks) that we manage for clients at CastleMoore, we continue to be fully exposed to risk (stocks) after flipping from our low volatility stance around the end of March and our performance is benefitting. The conflict in Iran remains a wildcard and we are running down our cues that would warrant a more defensive posture in risk assets. While we do not have the signals to sell equity exposure, some portfolio hedges here are probably prudent and we implemented some of those during the Wednesday session, based on what we reported on in our April 22 Market Outlook. Subscribers can view the themes in our chart books to either Accumulate or Avoid that we continue to gear portfolios towards.
Today, in our Market Outlook to subscribers, we discuss the following:
- Market Trend: Uptrend Intact, but Near-term Resistance has been Derived
- Short-Covering Rally Is Fading
- The Key Test to look out for in our Favoured Sector Ahead
- Rates & USD Are Critical
- Portfolio Stance: Stay Invested, Add Hedges
- Labour Market: Still Stable, No Red Flags Yet
- Natural Gas: Thesis Breaking Down
Subscribers can look for this report in their inbox or by clicking on the following link and logging in: Market Outlook for April 24
Not signed up yet? Subscribe now to receive full access to all of the research and analysis that we publish
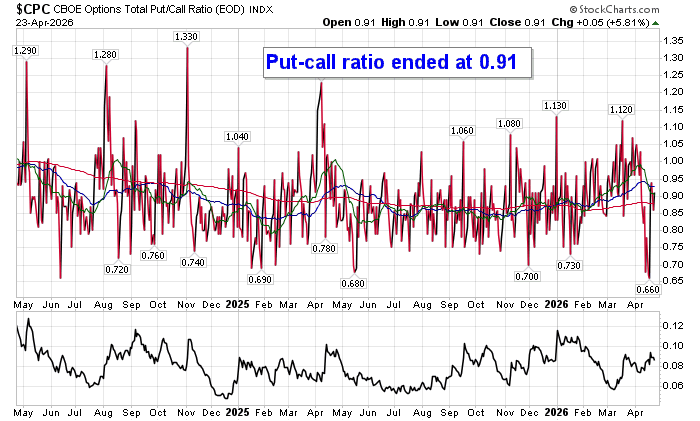
Sentiment on Thursday, as gauged by the put-call ratio, ended close to neutral at 0.91.
Seasonal charts of companies reporting earnings today:


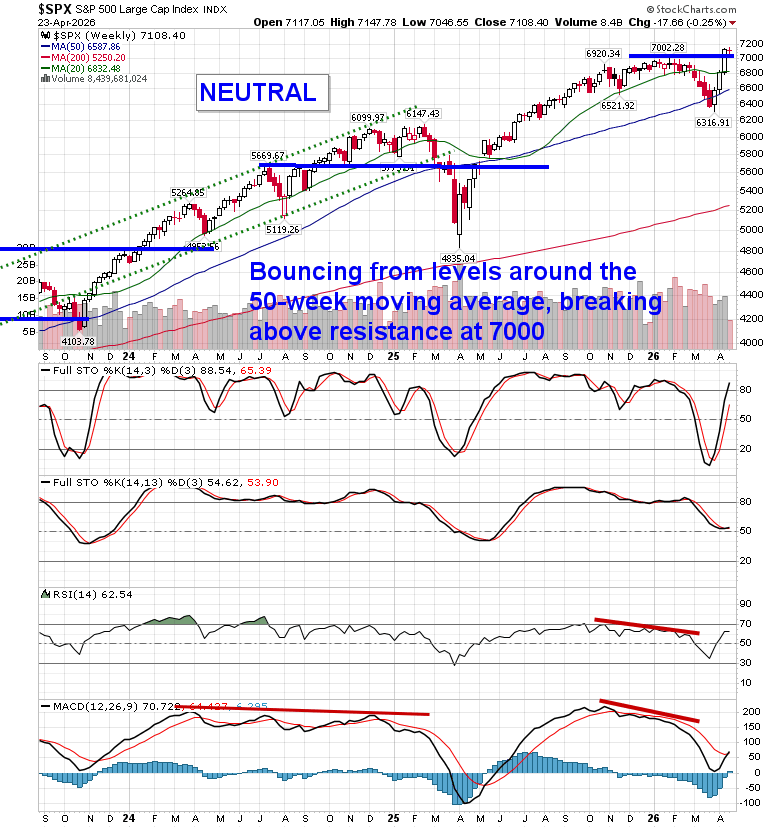
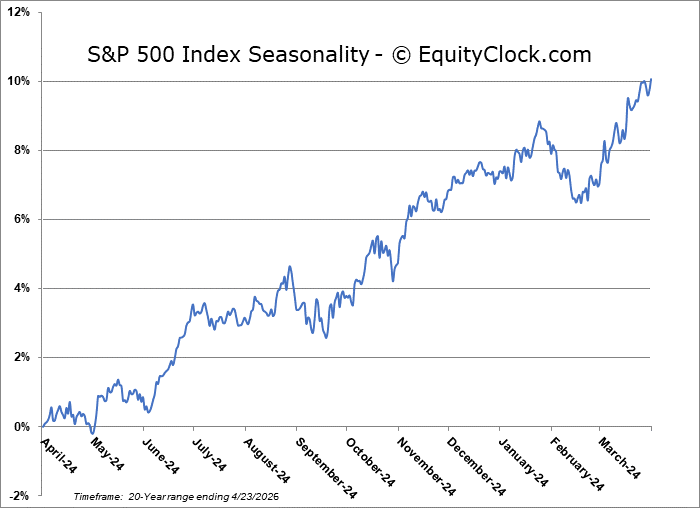
S&P 500 Index
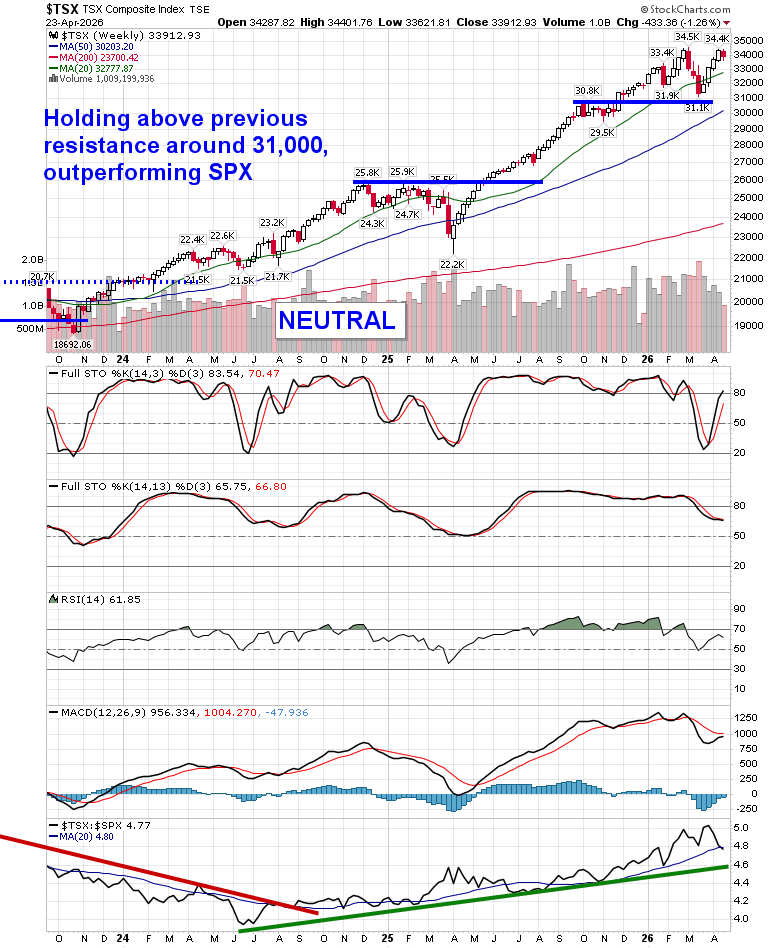
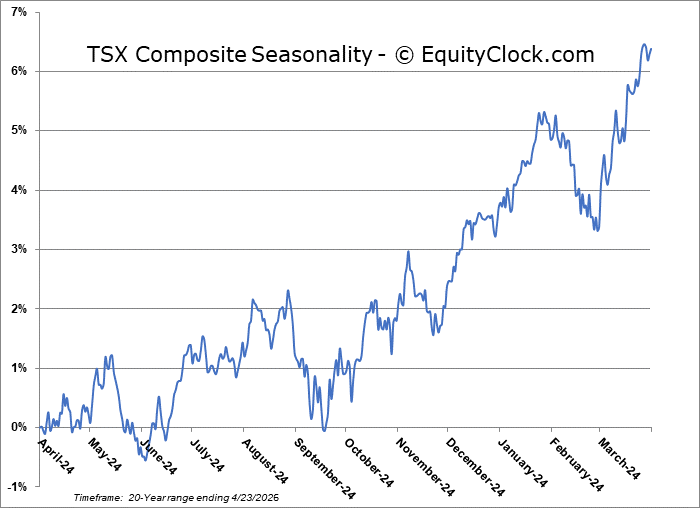
TSE Composite
| Sponsored By... |

|


