Stock Market Outlook for June 22, 2026

Looking at the state of the energy market following last week’s destruction.
*** Stocks highlighted are for information purposes only and should not be considered as advice to purchase or to sell mentioned securities. As always, the use of technical and fundamental analysis is encouraged in order to fine tune entry and exit points to average seasonal trends.
Stocks Entering Period of Seasonal Strength Today:
Subscribers Click on the relevant link to view the full profile. Not a subscriber? Signup here.
ETF Highlight: |
|

iShares MSCI India ETF (AMEX:INDA) Seasonal Chart |
|

Carmax Inc. (NYSE:KMX) Seasonal Chart

Marathon Digital Holdings Inc (NASD:MARA) Seasonal Chart

Rhythm Pharmaceuticals, Inc. (NASD:RYTM) Seasonal Chart

BioLife Solutions Inc. (NASD:BLFS) Seasonal Chart

Casella Waste Systems, Inc. (NASD:CWST) Seasonal Chart

Stellar Biotechnologies, Inc. (NASD:EDSA) Seasonal Chart

WisdomTree New Economy Real Estate Fund (AMEX:WTRE) Seasonal Chart

J.P. Morgan Chase & Co. (NYSE:JPM) Seasonal Chart

Stanley Black & Decker Inc. (NYSE:SWK) Seasonal Chart

M/I Homes, Inc. (NYSE:MHO) Seasonal Chart

Matson, Inc. (NYSE:MATX) Seasonal Chart
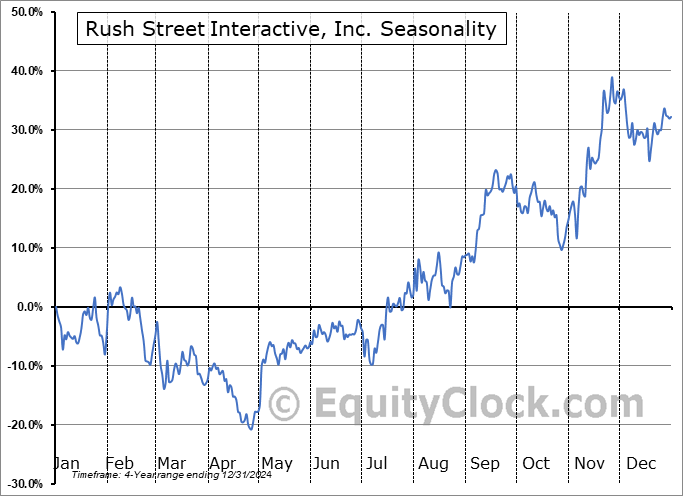
Rush Street Interactive, Inc. (NYSE:RSI) Seasonal Chart
Disclaimer: Comments and opinions offered in this report are for information only. They should not be considered as advice to purchase or to sell mentioned securities. Data offered is believed to be accurate, but is not guaranteed.
Note: With the markets closed on Friday for the Juneteenth National Independence Day, our next report will be provided on Monday. Enjoy the long weekend!
The Markets
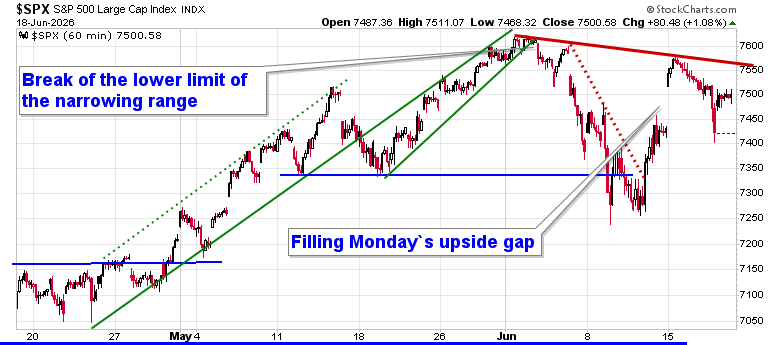
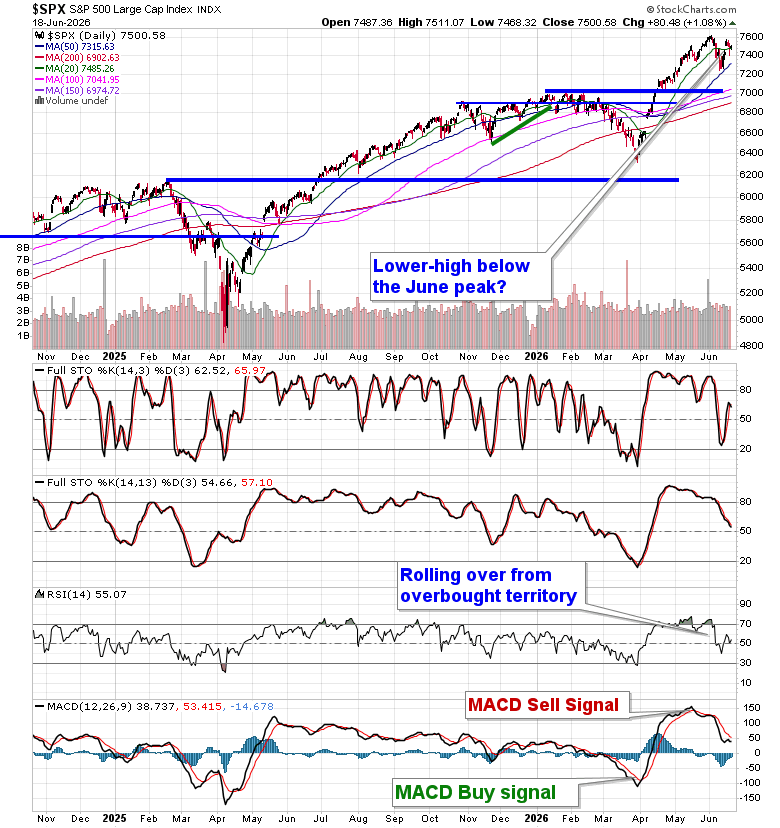
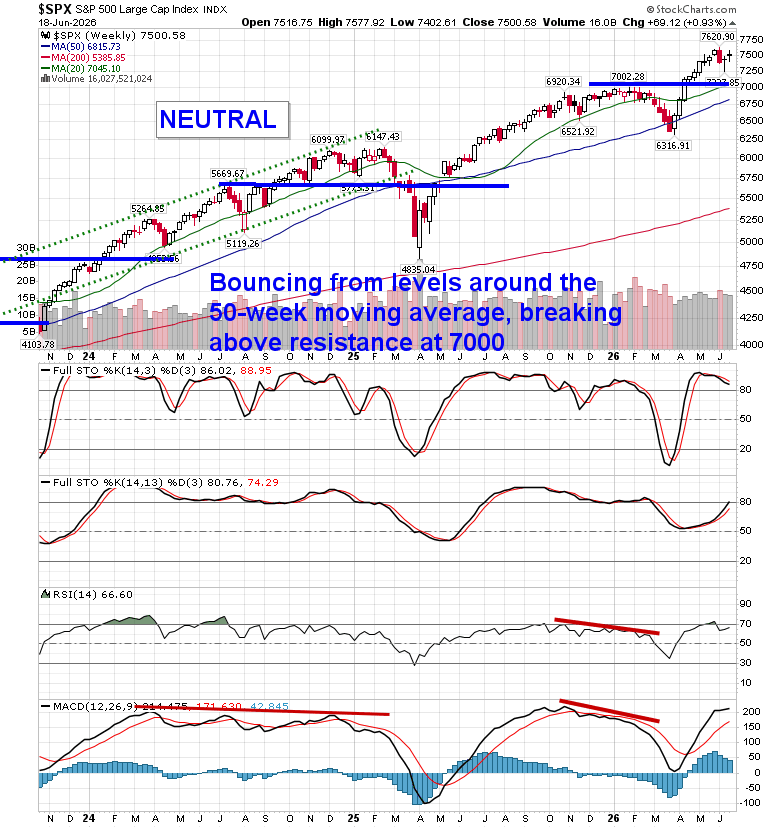
Stocks mostly recovered from their Wednesday dip as traders sought to close the books on this holiday shortened week on a positive note. The S&P 500 Index gained 1.08%, trading within the range of Monday’s upside gap and re-intersecting with its 20-day moving average. The ultra-short-term trend of the benchmark still shows lower-lows and lower-highs for the month of June, a notoriously mean reverting month that tends to result in a digestion of early year gains. Intermediate-term support at the 50-day moving average at 7315 has, so far, stood in the way of a more detrimental digestion of early year strength, coinciding with end of quarter rebalancing, but the appearance of a lower short-term high below the early June peak places our downside risk target of 7000 (previous horizontal resistance) back on the table. Daily momentum indicators are negatively diverging from price, emphasizing the upside exhaustion/digestion that the price action has portrayed in recent weeks. In the Seasonal Advantage Portfolio that we manage for clients at CastleMoore, we remain positioned for this more volatile/risk-off market framework and we chose not to react to the positivity that the market had shown early in the week that was pushing back against our thesis of how the market was to perform in this last month of the quarter (eg. digestion of early year gains). The state of the energy market and the impact of the cost of borrowing/value of the dollar remain key risks to the market, something that continues to be scrutinized. Subscribers can view the themes in our chart books to either Accumulate or Avoid that we continue to gear portfolios towards.
Today, in our Market Outlook to subscribers, we discuss the following:
- Weekly look at the large-cap benchmark
- Technology and Emerging Markets
- Biotechnology Emerging as a New Opportunity
- Taking a look at the energy market following last week’s destruction
- Portfolio positioning
Subscribers can look for this report in their inbox or by clicking on the following link and logging in: Market Outlook for June 22
Not signed up yet? Subscribe now to receive full access to all of the research and analysis that we publish
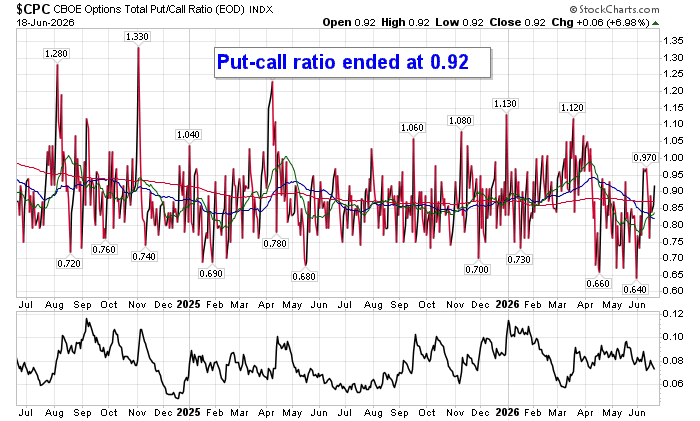
Sentiment on Thursday, as gauged by the put-call ratio, ended bullish at 0.92.
Seasonal charts of companies reporting earnings today:
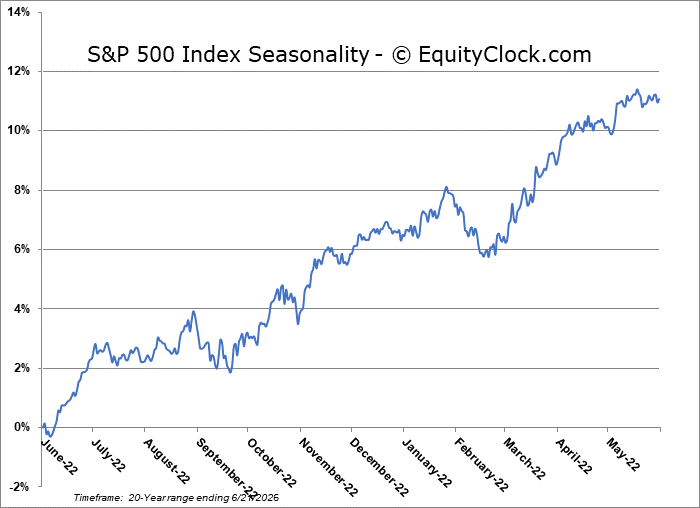
S&P 500 Index
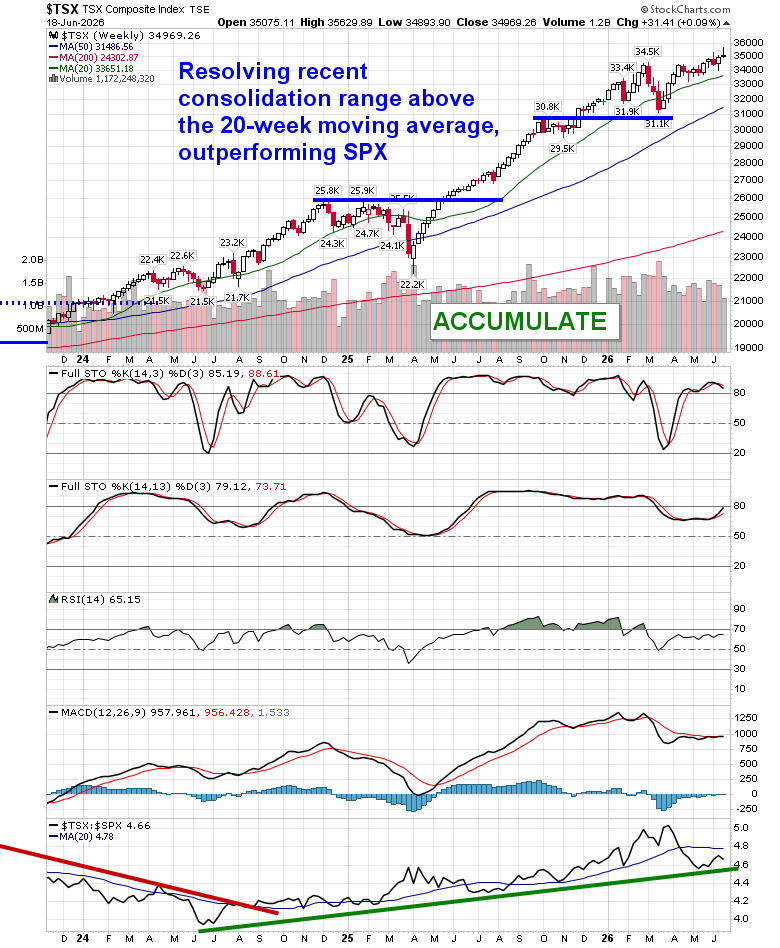
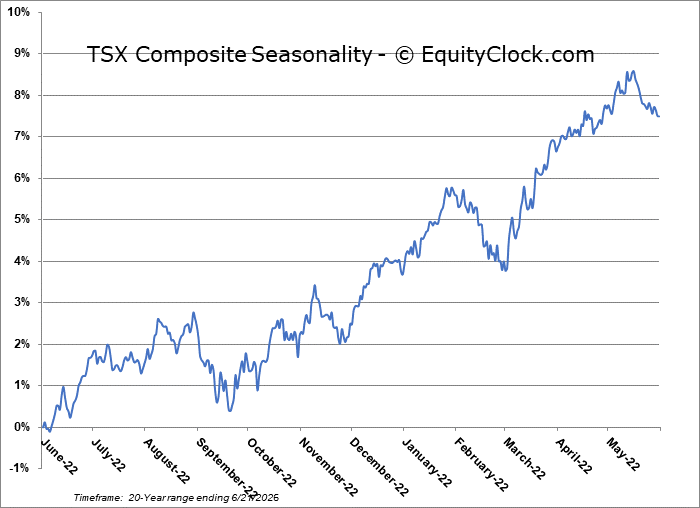
TSE Composite
| Sponsored By... |

|


