Stock Market Outlook for June 16, 2026

Stocks jump, Oil drops, and Treasury Yields unchanged?
*** Stocks highlighted are for information purposes only and should not be considered as advice to purchase or to sell mentioned securities. As always, the use of technical and fundamental analysis is encouraged in order to fine tune entry and exit points to average seasonal trends.
Stocks Entering Period of Seasonal Strength Today:
Subscribers Click on the relevant link to view the full profile. Not a subscriber? Signup here.
Stock Highlight: |
|

Alpha and Omega Semiconductor Ltd. (NASD:AOSL) Seasonal Chart |
|
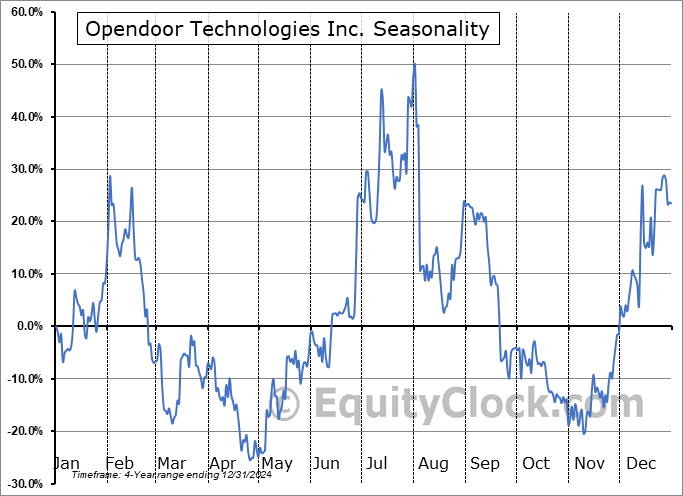
Opendoor Technologies Inc. (NASD:OPEN) Seasonal Chart
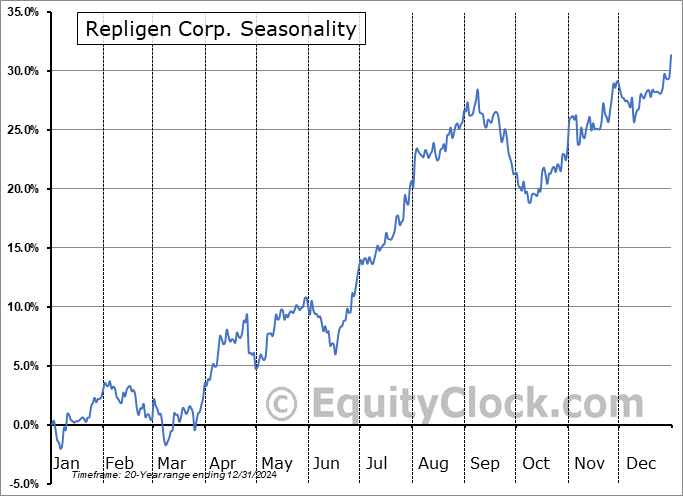
Repligen Corp. (NASD:RGEN) Seasonal Chart

Daktronics, Inc. (NASD:DAKT) Seasonal Chart

Target Corp. (NYSE:TGT) Seasonal Chart
Disclaimer: Comments and opinions offered in this report are for information only. They should not be considered as advice to purchase or to sell mentioned securities. Data offered is believed to be accurate, but is not guaranteed.
The Markets
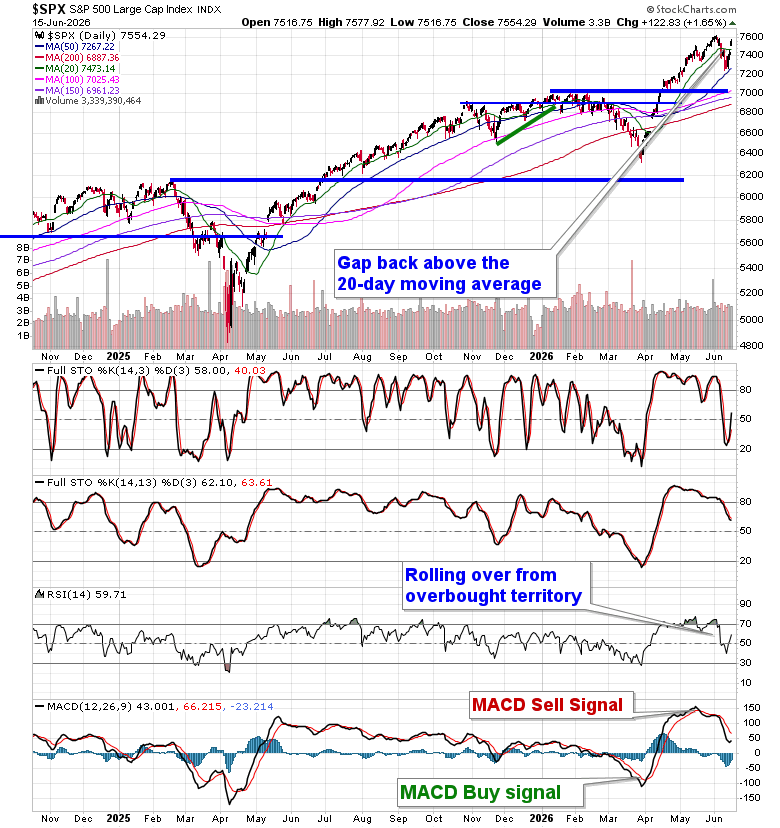
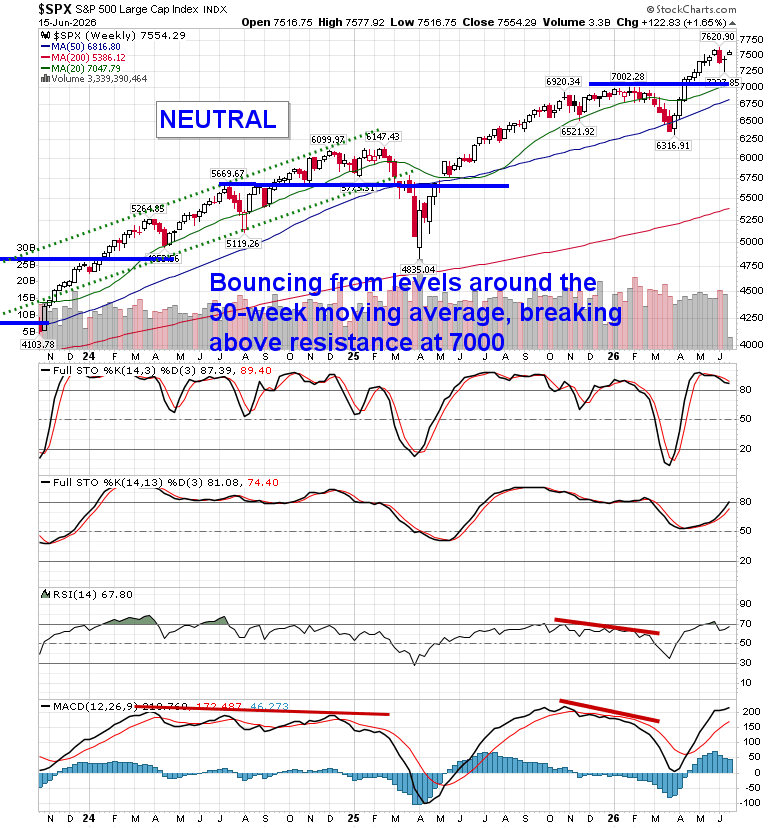
Stocks jumped on Monday amidst a sharp pullback in the price of Oil following news over the weekend that the US and Iran reached a deal to end the war. The S&P 500 Index gaped higher above recent resistance around its 20-day moving average, gaining 1.65% on the day. The gap charted between 7450 and 7516 now forms a zone of support below the market. Intermediate-term support at the 50-day moving average at 7267 has stood in the way of a more detrimental digestion of early year strength, coinciding with end of quarter rebalancing. In the Seasonal Advantage Portfolio that we manage for clients at CastleMoore, we remain positioned for a more volatile/risk-off market framework and we have managed to stay afloat in both positive and negative sessions this month, generating significant alpha in the process. The state of the energy market and corresponding impact on the cost of borrowing/value of the dollar are the ongoing wildcards, but we have been positioning based on what is tangible, rather than speculation on what may result. Subscribers can view the themes in our chart books to either Accumulate or Avoid that we continue to gear portfolios towards.
- Currencies
- Cryptocurrencies
- Commodities
- Major Benchmarks
- Sub-sectors / Industries
- ETFs: Bonds | Commodities | Equity Markets | Industries | Sectors
Today, in our Market Outlook to subscribers, we discuss the following:
- Our weekly chart books update, along with our list of all of the segments of the market to either Accumulate or Avoid
- Key Market Risks
- Other Notes
- Sector Positioning Takeaways
Subscribers can look for this report in their inbox or by clicking on the following link and logging in: Market Outlook for June 16
Not signed up yet? Subscribe now to receive full access to all of the research and analysis that we publish
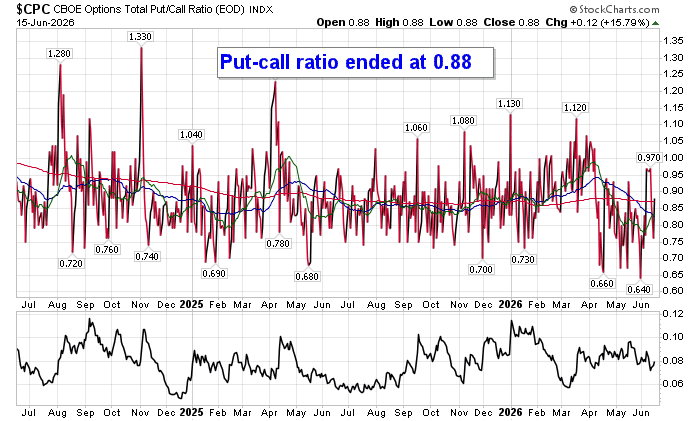
Sentiment on Monday, as gauged by the put-call ratio, ended bullish at 0.88.
Seasonal charts of companies reporting earnings today:


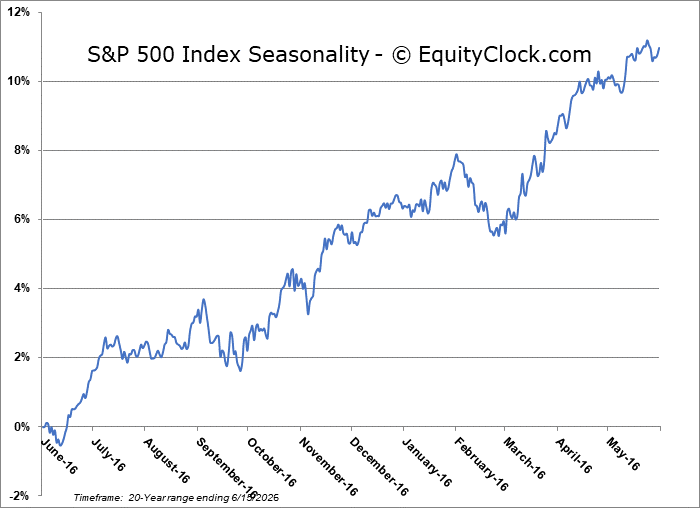
S&P 500 Index
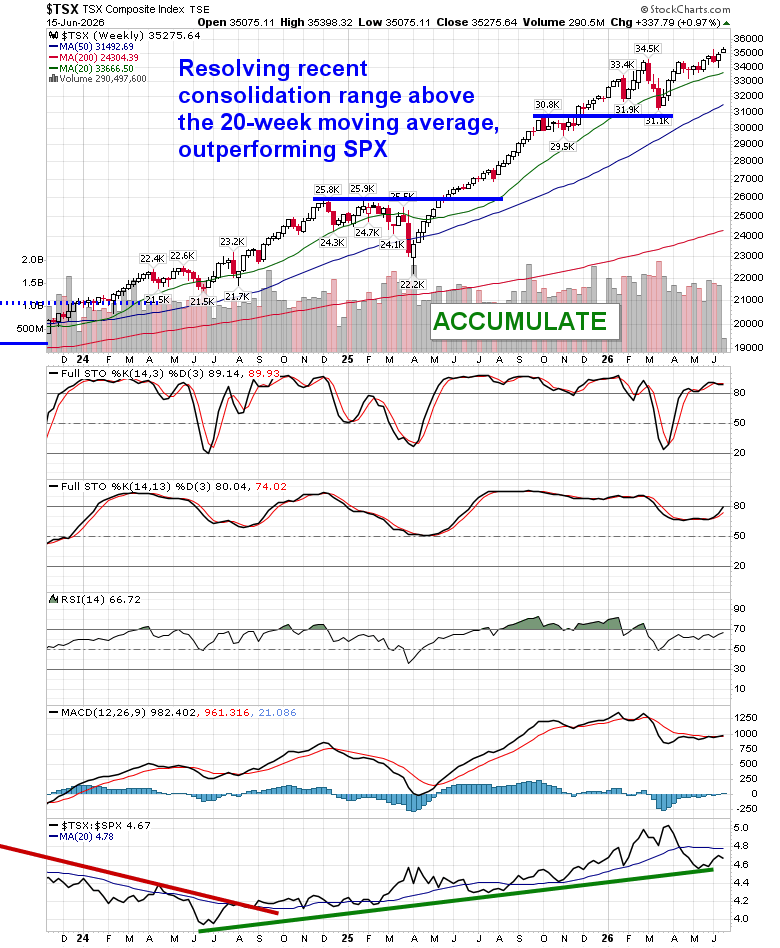
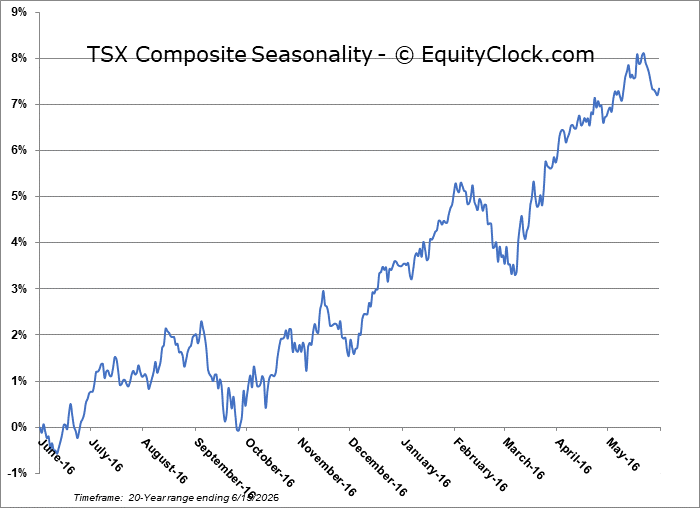
TSE Composite
| Sponsored By... |

|


