Stock Market Outlook for June 10, 2026

Gold below its 200-day moving average for the first time since 2023; We break down when and where to look to pickup exposure.
*** Stocks highlighted are for information purposes only and should not be considered as advice to purchase or to sell mentioned securities. As always, the use of technical and fundamental analysis is encouraged in order to fine tune entry and exit points to average seasonal trends.
Stocks Entering Period of Seasonal Strength Today:
Subscribers Click on the relevant link to view the full profile. Not a subscriber? Signup here.
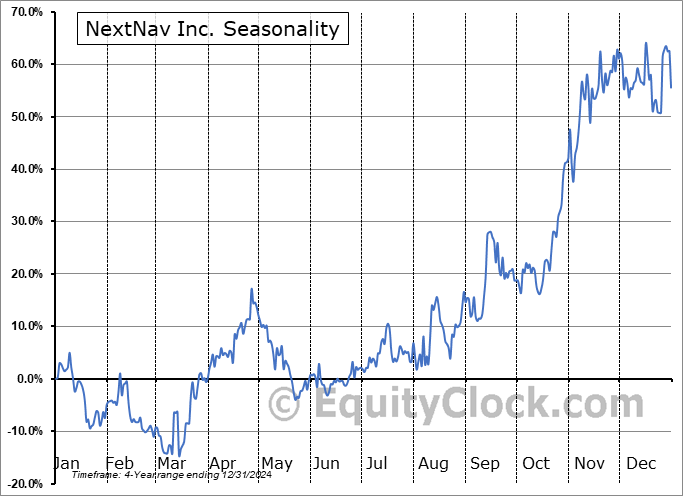
NextNav Inc. (NASD:NN) Seasonal Chart

America Movil S.A. de CV (NYSE:AMX) Seasonal Chart
Disclaimer: Comments and opinions offered in this report are for information only. They should not be considered as advice to purchase or to sell mentioned securities. Data offered is believed to be accurate, but is not guaranteed.
The Markets
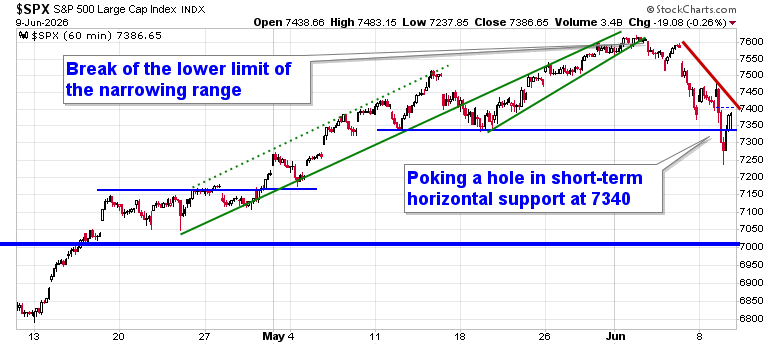
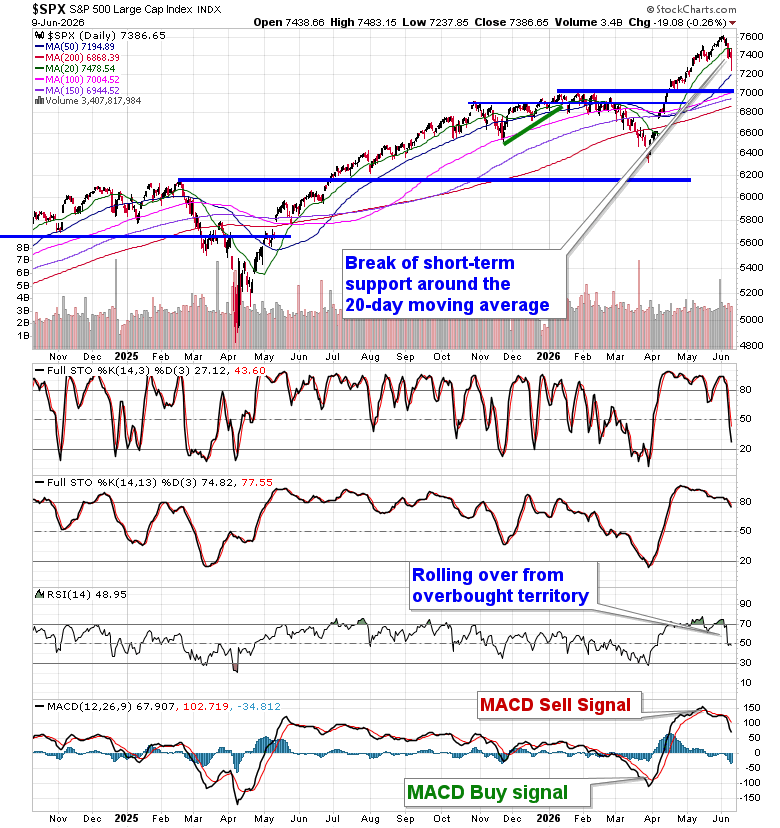
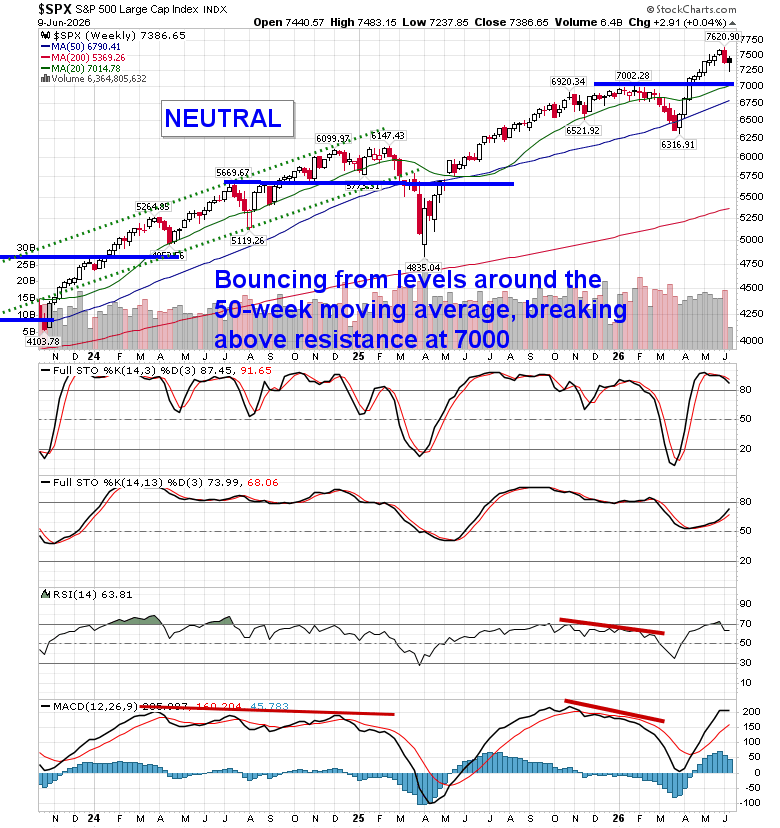
Further rotation/profit-taking in the red-hot technology sector pressured broad equity benchmarks lower on Tuesday. The S&P 500 Index posted a loss of a quarter of one percent, poking a hole in horizontal support at 7340. A cap has been imposed around the 7600 level and variable support around the rising 20-day moving average (7,480) has been violated, providing a hurdle that short-term traders were selling into over the past couple of days. Levels back to previously broken horizontal resistance around 7000 are fair game amidst a digestion of early year strength aligned with this weaker period on the calendar before the end of the quarter. In the Seasonal Advantage Portfolio that we manage for clients at CastleMoore, we had been prepared for a more volatile/risk-off market framework prior to this downfall and we are little impacted by this risk-off move. The conflict/deal in Iran is the ongoing wildcard and the cues that we have been following that warranted moving towards a more defensive posture in risk assets have not gone away (and, arguably, our thesis was reconfirmed, in a big way, in the past week). Subscribers can view the themes in our chart books to either Accumulate or Avoid that we continue to gear portfolios towards.
Today, in our Market Outlook to subscribers, we discuss the following:
- The downfall of Gold and its miners and when and where to look to buy
- The strong correlation the Volatility Index has shown to the seasonal norm this year
- US Existing Home Sales and the investment implications from this discerning consumer backdrop
- Strong export activity in both Canada and the US and the investment implications from International Trade
Subscribers can look for this report in their inbox or by clicking on the following link and logging in: Market Outlook for June 10
Not signed up yet? Subscribe now to receive full access to all of the research and analysis that we publish
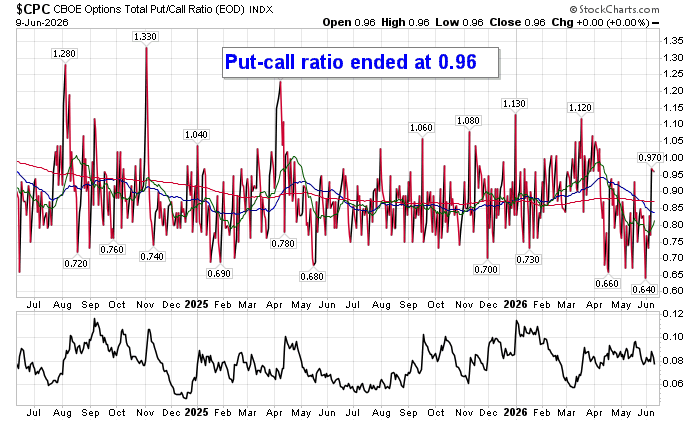
Sentiment on Tuesday, as gauged by the put-call ratio, ended fairly neutral at 0.96.
Seasonal charts of companies reporting earnings today:


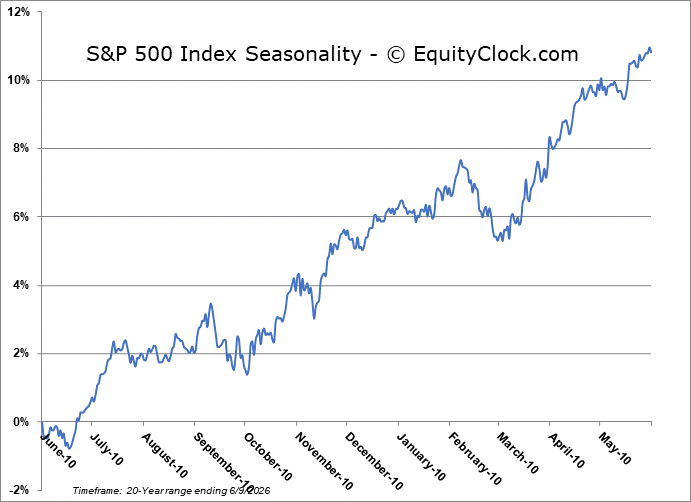
S&P 500 Index
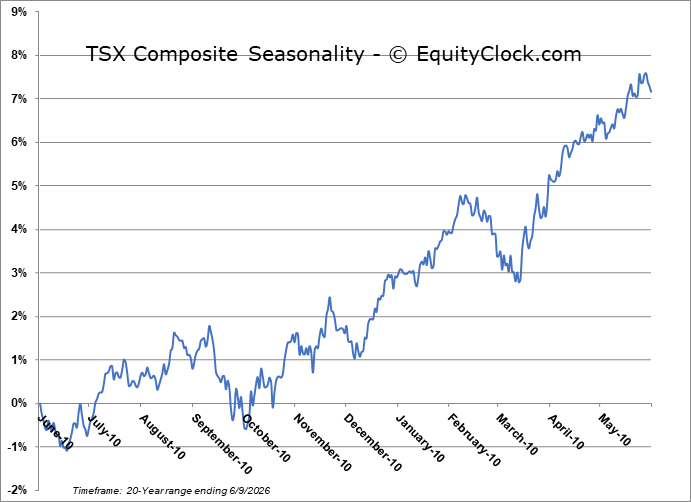
TSE Composite

| Sponsored By... |

|


