Stock Market Outlook for July 24, 2026

Initial Jobless Claims just fell to the lowest level since 1969 and this backs our positive view in Accumulate rated beneficiaries.
*** Stocks highlighted are for information purposes only and should not be considered as advice to purchase or to sell mentioned securities. As always, the use of technical and fundamental analysis is encouraged in order to fine tune entry and exit points to average seasonal trends.
Stocks Entering Period of Seasonal Strength Today:
Subscribers Click on the relevant link to view the full profile. Not a subscriber? Signup here.
Stock Highlight: |
|

Chubb Ltd. (NYSE:CB) Seasonal Chart |
|

SPDR Portfolio Aggregate Bond ETF (AMEX:SPAB) Seasonal Chart

First Trust High Income ETF (NASD:FTHI) Seasonal Chart

Invesco KBW Property & Casualty Insurance ETF (NASD:KBWP) Seasonal Chart

Schwab US TIPS ETF (NYSE:SCHP) Seasonal Chart

Fortive Corp. (NYSE:FTV) Seasonal Chart

iShares Core Balanced ETF Portfolio (TSE:XBAL.TO) Seasonal Chart

Thor Industries, Inc. (NYSE:THO) Seasonal Chart
Disclaimer: Comments and opinions offered in this report are for information only. They should not be considered as advice to purchase or to sell mentioned securities. Data offered is believed to be accurate, but is not guaranteed.
The Markets
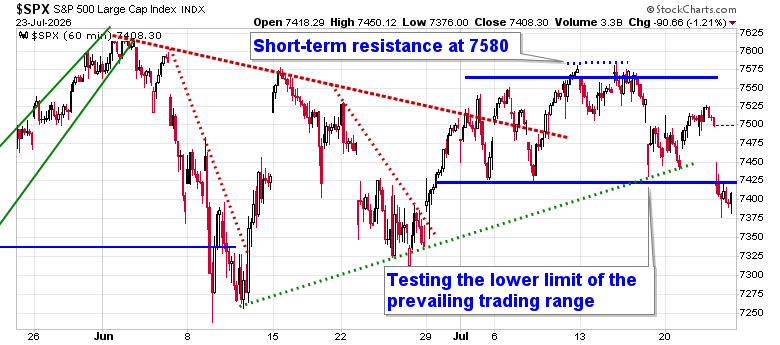
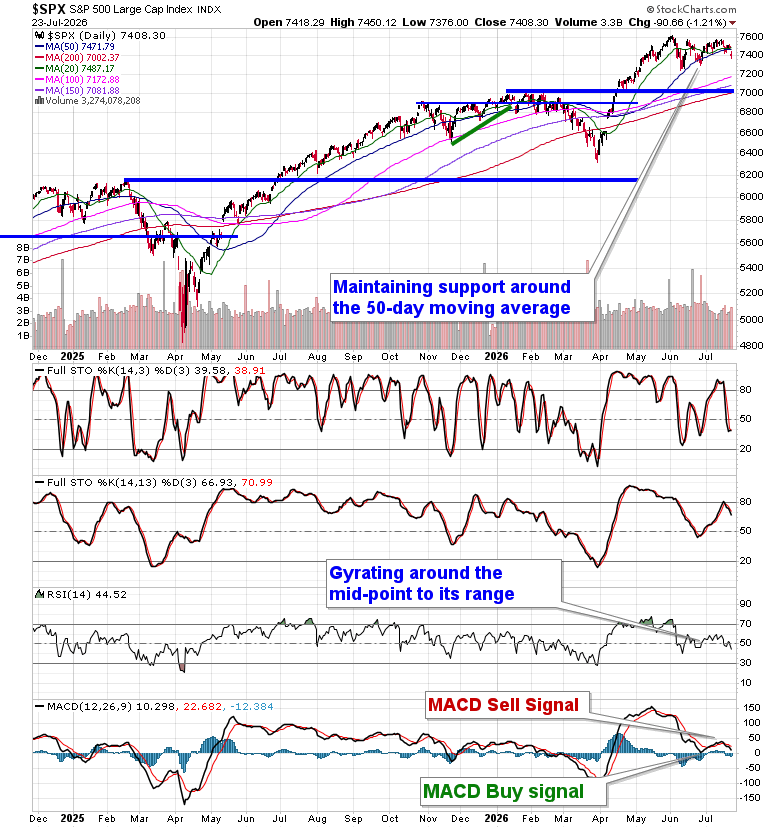
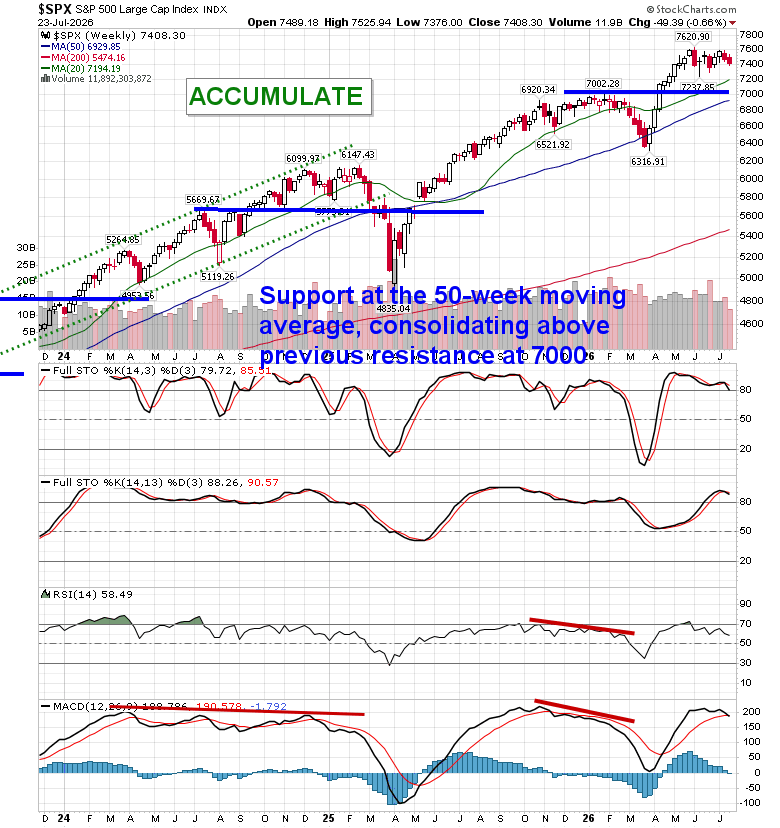
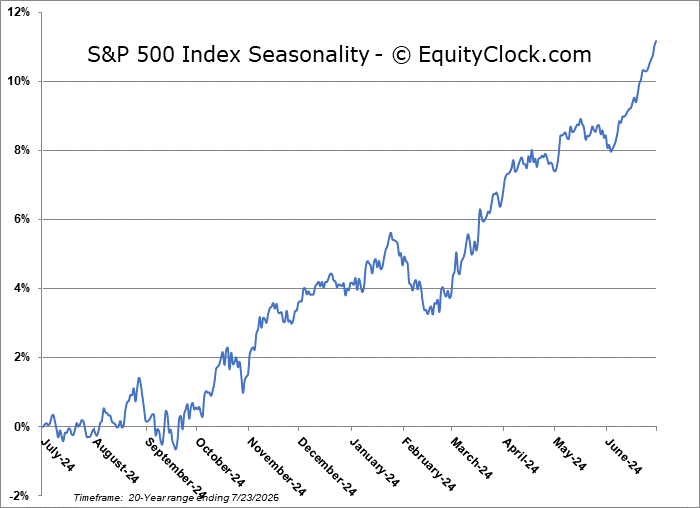
Ongoing pressures from the price of oil and the cost of borrowing (interest rates) acted as a cloud over the equity market on Thursday. Sharply negative reaction to earnings from Tesla (TSLA) and Alphabet (GOOGL) didn’t help. The S&P 500 Index lost 1.21%, gaping below the lower limit of the short-term trading range between 7425 and 7550. The resolution of the span proposes a move of 125-points in the direction of break, or to 7300. While we have to adopt this downbeat target as the base case, we have seen a false break of the span before (albeit to the upside) that ultimately reversed. The weight of the escalating conflict between the US and Iran may be too burdensome this time around. Support on the daily chart has been broken around 20 and 50-day moving averages (~7471), which have converged on one another in a bearish manner. Daily momentum indicators have rolled over in recent days with MACD triggering a fresh sell signal, now aligning with the end of the summer rally period that came to an end on July 17th. In the Seasonal Advantage Portfolio that we manage for clients at CastleMoore, we have not made any changes in our allocations, yet. Following a first half performance in the Seasonal Advantage Portfolio that was well ahead of our own benchmark (as well as all major equity benchmarks in the market), we still have a bias to expect strength for the start of the second half of the year, aligning with the optimism that the manufacturing economy expressing, but we are scrutinizing the risks that have abruptly escalated with the increase in geopolitical tensions. The start of earnings season provides some cover to the headline threats. Subscribers can view what we are targeting in our list of market segments to either Accumulate or Avoid.
Today, in our Market Outlook to subscribers, we discuss the following:
- Rising oil prices influencing the cost of borrowing back toward multi-year highs
- Canadian Retail Sales and the investment implications within
- Benefiting from our bearish view of Consumer Discretionary and Communications Services stocks
- The sharp drop in jobless claims last week and what it means for portfolio positioning heading into the back half of the year
Subscribers can look for this report in their inbox or by clicking on the following link and logging in: Market Outlook for July 24
Not signed up yet? Subscribe now to receive full access to all of the research and analysis that we publish
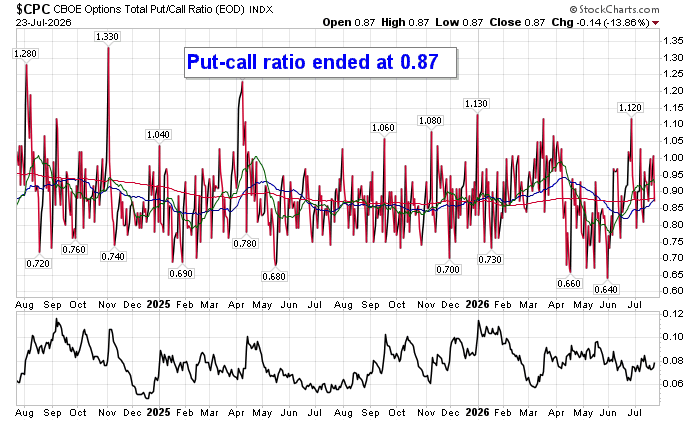
Sentiment on Thursday, as gauged by the put-call ratio, ended bullish at 0.87.
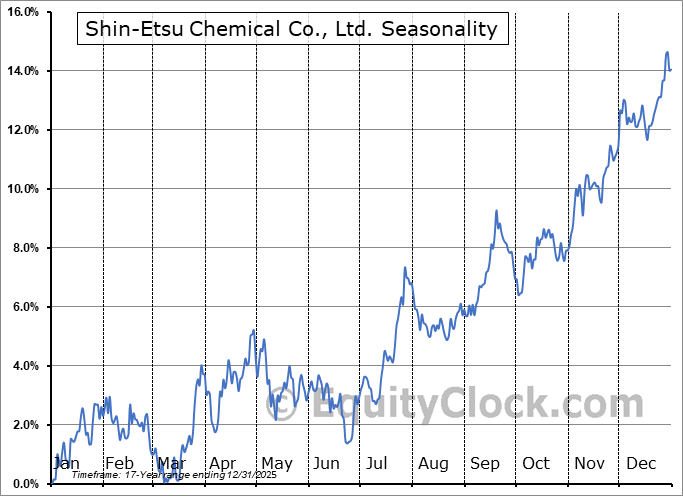
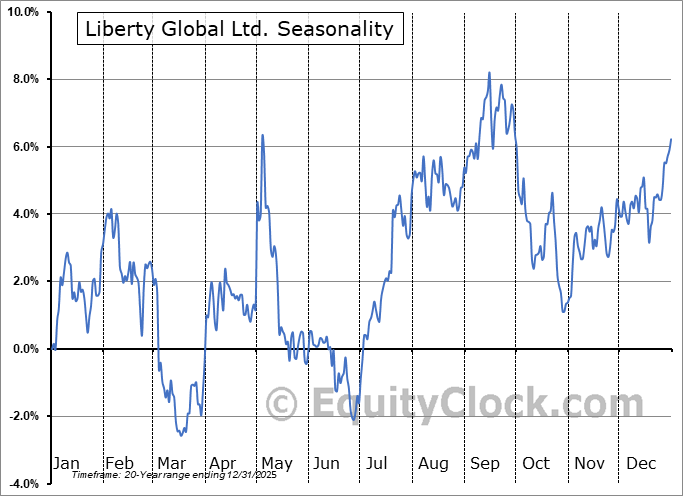
Seasonal charts of companies reporting earnings today:








S&P 500 Index
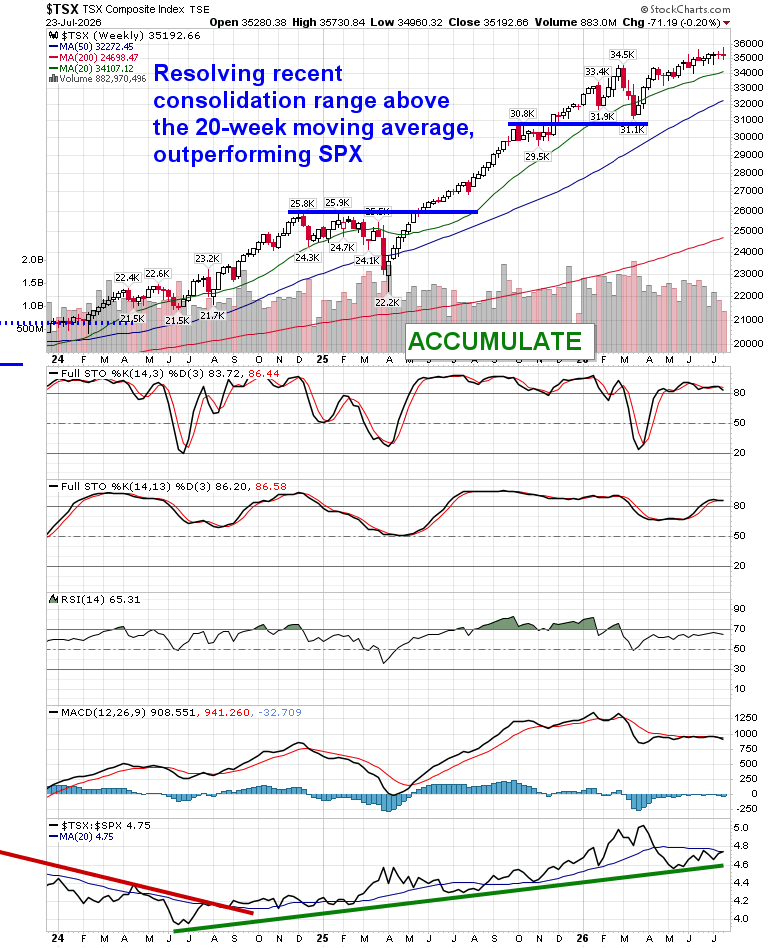
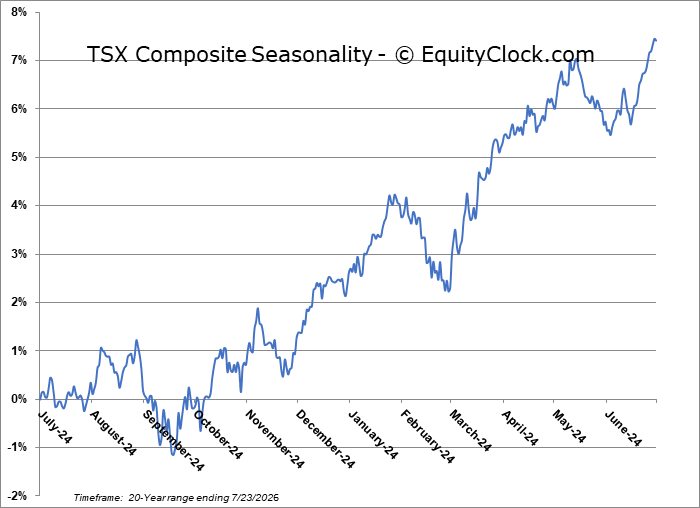
TSE Composite
| Sponsored By... |

|


