Stock Market Outlook for June 24, 2026

The Technology sector ETF revealing a lower-high below the early June peak: Should you be concerned?
*** Stocks highlighted are for information purposes only and should not be considered as advice to purchase or to sell mentioned securities. As always, the use of technical and fundamental analysis is encouraged in order to fine tune entry and exit points to average seasonal trends.
Stocks Entering Period of Seasonal Strength Today:
Subscribers Click on the relevant link to view the full profile. Not a subscriber? Signup here.
Stock Highlight: |
|

WSFS Financial Corp. (NASD:WSFS) Seasonal Chart |
|

Banco Bilbao Vizcaya Argentaria, SA (NYSE:BBVA) Seasonal Chart

Washington Trust Bancorp, Inc. (NASD:WASH) Seasonal Chart
Disclaimer: Comments and opinions offered in this report are for information only. They should not be considered as advice to purchase or to sell mentioned securities. Data offered is believed to be accurate, but is not guaranteed.
The Markets
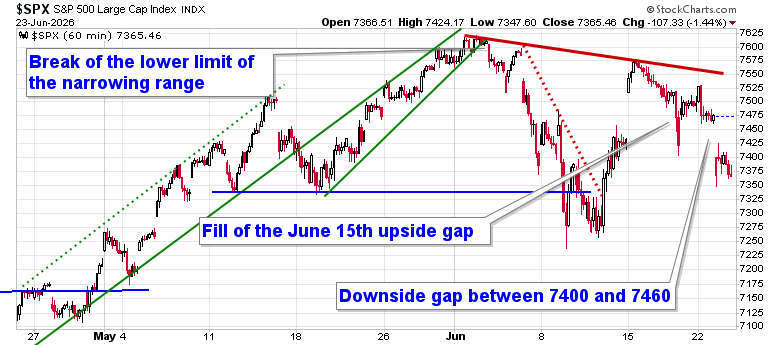
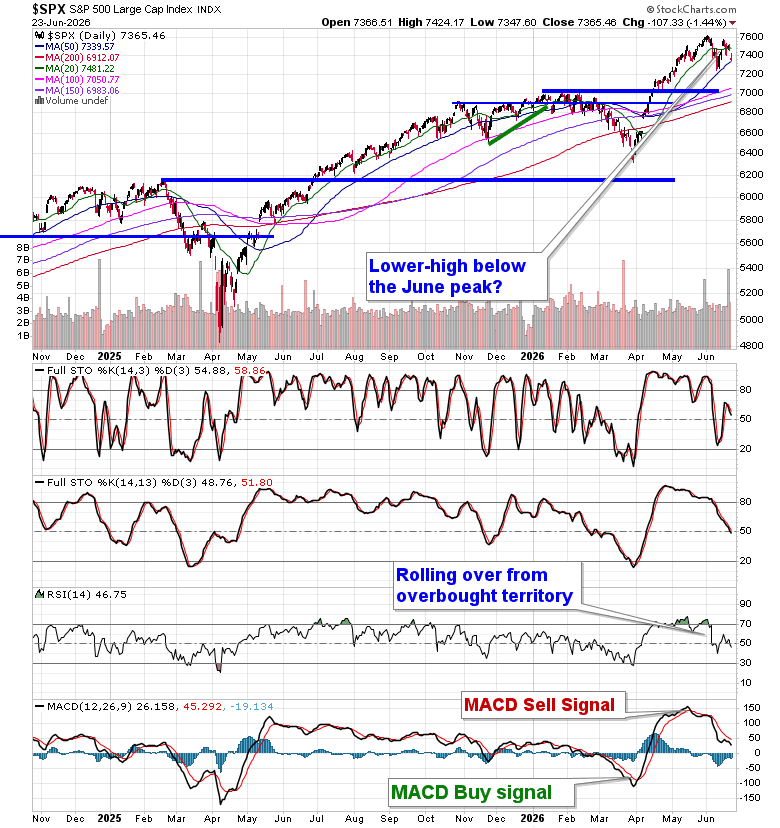
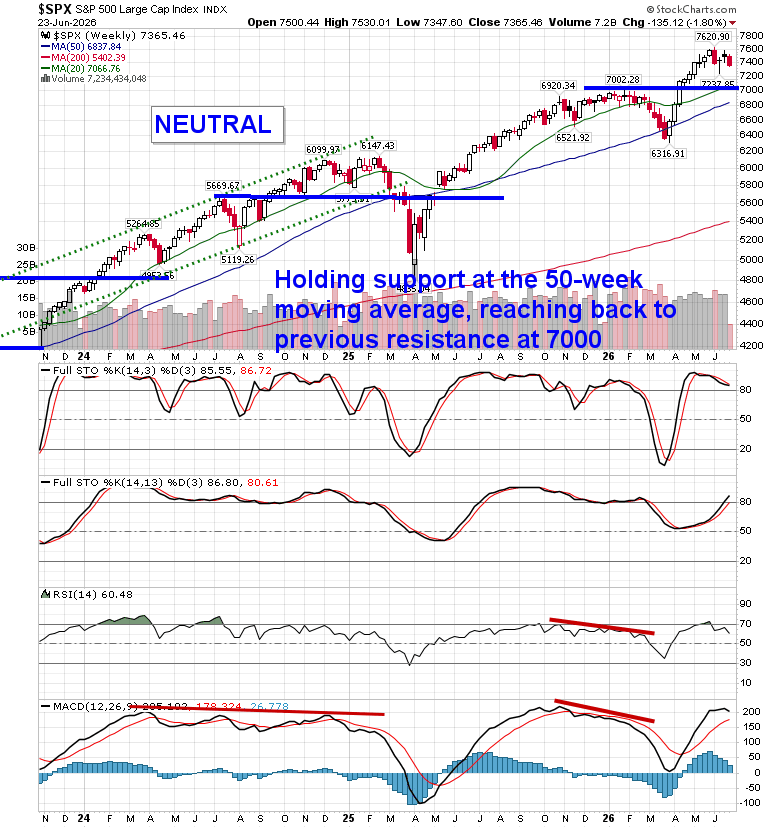
A sharp selloff in the Technology sector took a toll on broad market benchmarks during the Tuesday session as portfolio managers rebalance their books before the end of the quarter. The S&P 500 Index fell by 1.44%, moving below the range of the June 15th upside gap and slipping back below its 20-day moving average. A downside gap between 7400 and 7460 defines another barrier overhead for the benchmark to contend with. The ultra-short-term trend of the benchmark still shows lower-lows and lower-highs for the month of June, a notoriously mean reverting month that tends to result in a digestion of early year gains. Intermediate-term support at the 50-day moving average at 7339 is once again being testing, attempting to stand in the way of a more detrimental digestion of early year strength, coinciding with end of quarter rebalancing. The appearance of a lower short-term high below the early June peak keeps our downside risk target of 7000 (previous horizontal resistance) on the table. Daily momentum indicators have been negatively diverging from price, emphasizing the upside exhaustion/digestion that the price action has portrayed in recent weeks. In the Seasonal Advantage Portfolio that we manage for clients at CastleMoore, we remain positioned for this more volatile/risk-off market framework and we chose not to react to the positivity that the market had shown early last week that was pushing back against our thesis of how the market was to perform in this last month of the quarter (eg. digestion of early year gains). The state of the energy market and the impact of the cost of borrowing/value of the dollar remain key risks to the market, something that continues to be scrutinized. Subscribers can view the themes in our chart books to either Accumulate or Avoid that we continue to gear portfolios towards.
Today, in our Market Outlook to subscribers, we discuss the following:
- Digestion in stocks playing out as anticipated and preparing for the next move
- Looking at the lower-high that is forming on the Technology Sector ETF
- S&P 500 PEG Ratio
- Canada CPI and what is driving inflationary pressures north of the border
- High yield spreads around decade plus lows
Subscribers can look for this report in their inbox or by clicking on the following link and logging in: Market Outlook for June 24
Not signed up yet? Subscribe now to receive full access to all of the research and analysis that we publish
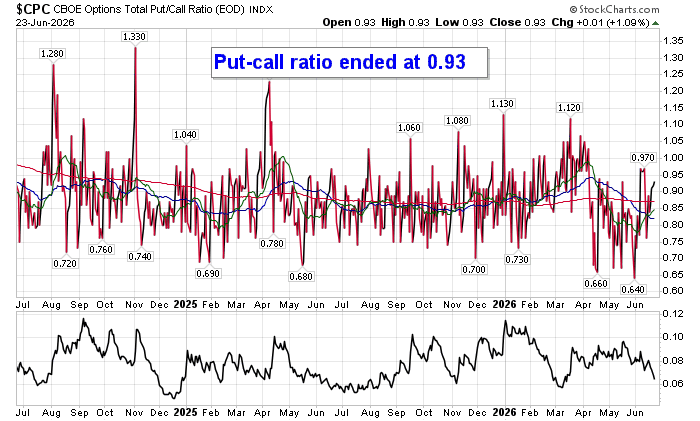
Sentiment on Tuesday, as gauged by the put-call ratio, ended slightly bullish at 0.93.
Seasonal charts of companies reporting earnings today:


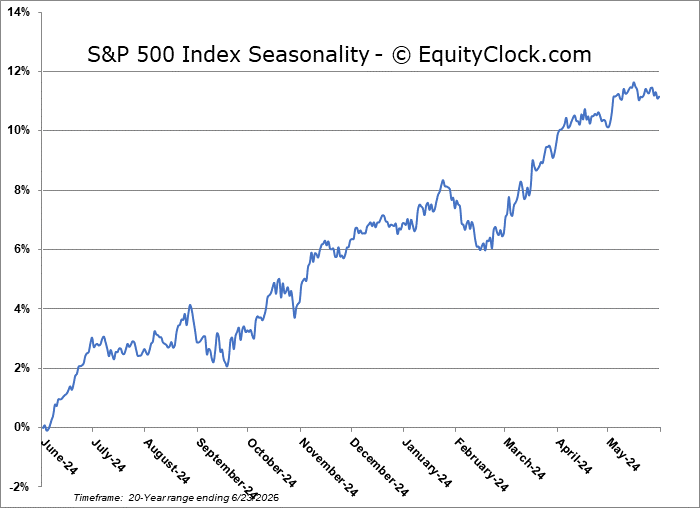
S&P 500 Index
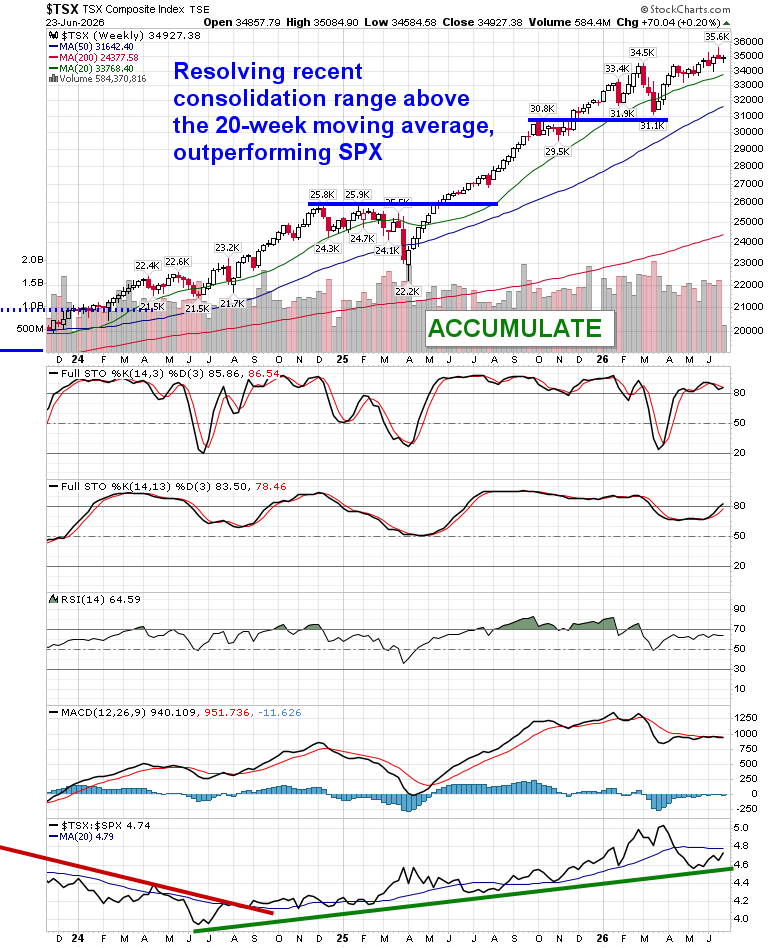
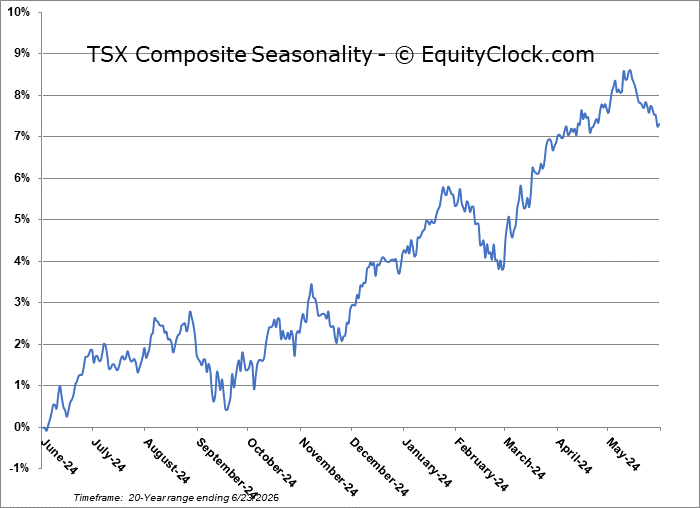
TSE Composite
| Sponsored By... |

|


