Stock Market Outlook for August 4, 2026

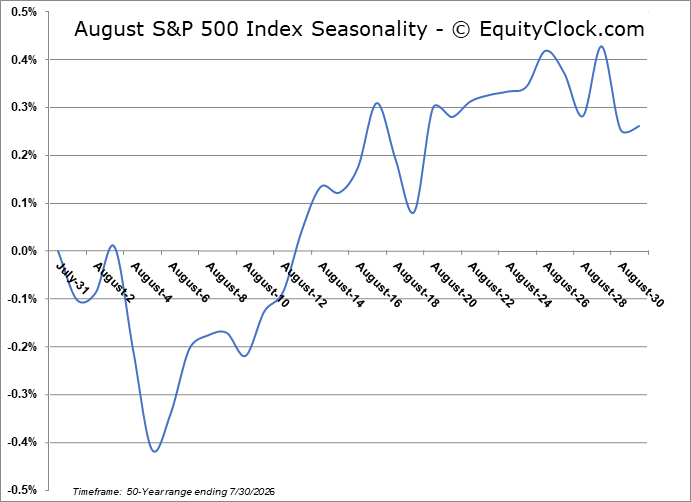
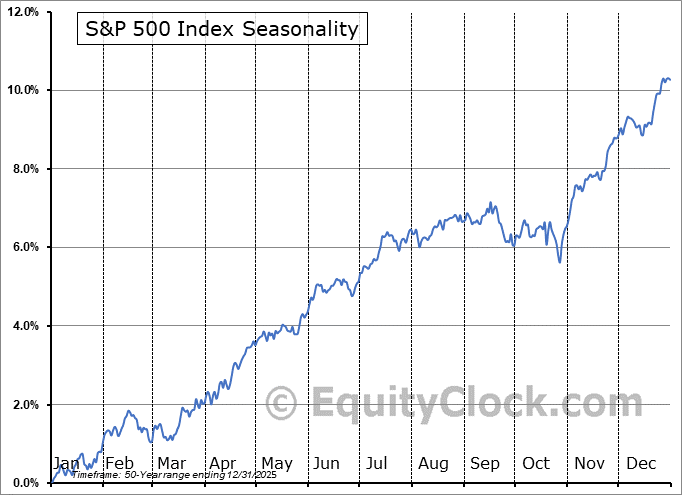
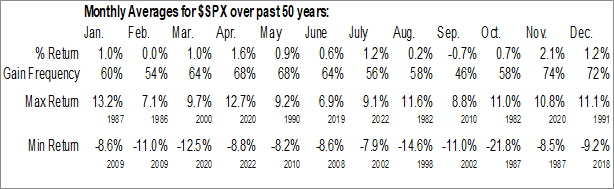
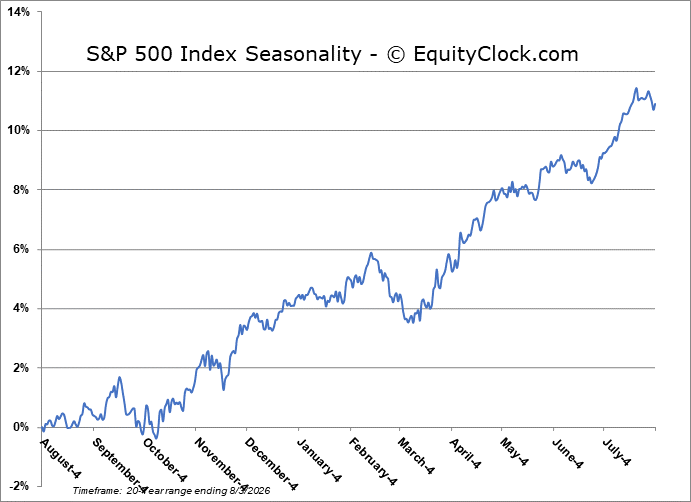
Over the past five decades, the S&P 500 Index has averaged a gain of a mere 0.2% in August, which is the third weakest return on the calendar.
*** Stocks highlighted are for information purposes only and should not be considered as advice to purchase or to sell mentioned securities. As always, the use of technical and fundamental analysis is encouraged in order to fine tune entry and exit points to average seasonal trends.
Stocks Entering Period of Seasonal Strength Today:
Subscribers Click on the relevant link to view the full profile. Not a subscriber? Signup here.
Stock Highlight: |
|
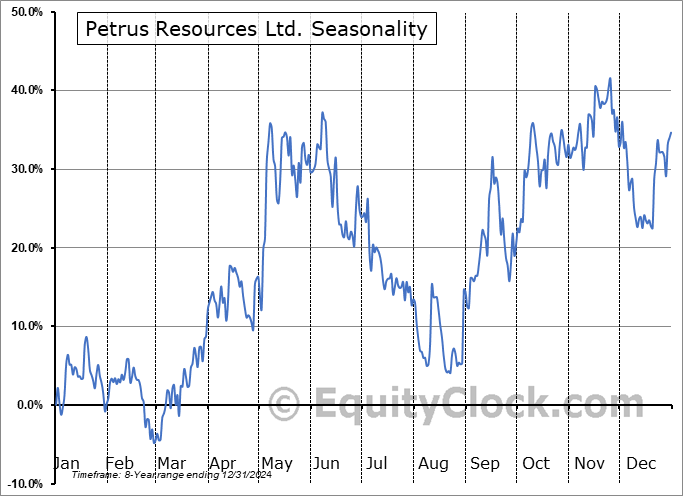
Petrus Resources Ltd. (TSE:PRQ.TO) Seasonal Chart |
|

Sysco Corp. (NYSE:SYY) Seasonal Chart

Polo Ralph Lauren Corp. (NYSE:RL) Seasonal Chart

Global X China Consumer ETF (NYSE:CHIQ) Seasonal Chart

Grid Dynamics Holdings Inc. (NASD:GDYN) Seasonal Chart

Best Buy Co, Inc. (NYSE:BBY) Seasonal Chart

Everest Group, Ltd. (NYSE:EG) Seasonal Chart

Banco Santander Brasil S A (NYSE:BSBR) Seasonal Chart

Par Pacific Holdings Inc. (NYSE:PARR) Seasonal Chart

kforce.com, Inc. (NYSE:KFRC) Seasonal Chart

Las Vegas Sands Corp. (NYSE:LVS) Seasonal Chart
Disclaimer: Comments and opinions offered in this report are for information only. They should not be considered as advice to purchase or to sell mentioned securities. Data offered is believed to be accurate, but is not guaranteed.
Note: There will be no Market Outlook report on Monday as a result of the Civic Holiday. Our weekly chart books will be updated on schedule on Sunday and we will send out our chart books notes to subscribers on Monday. Regular reports resume on Tuesday. Enjoy the weekend!
The Markets
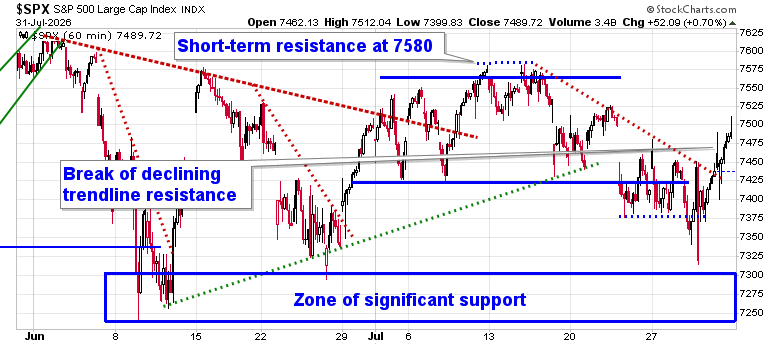
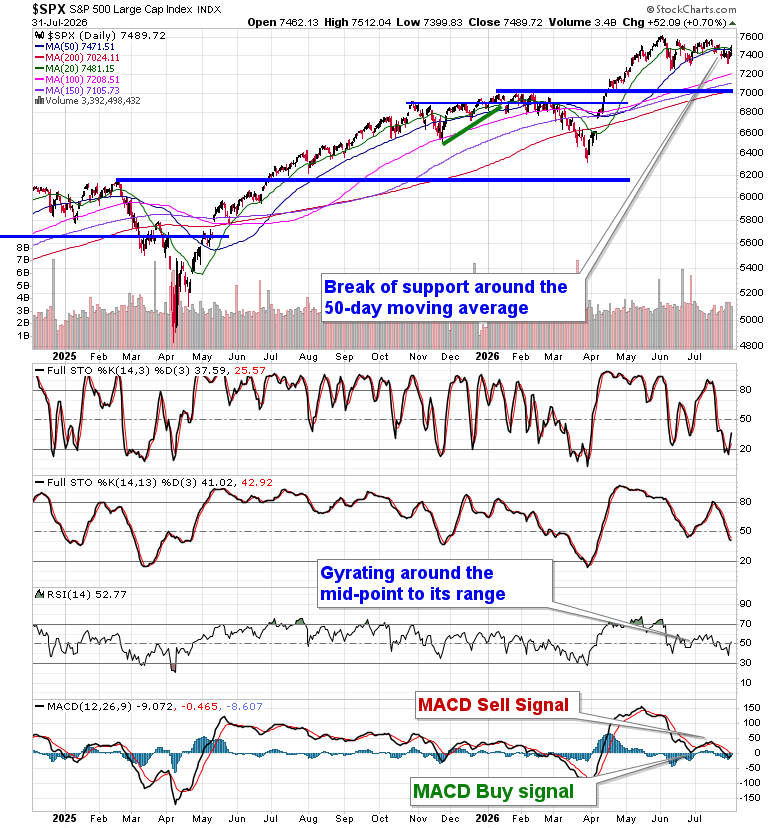
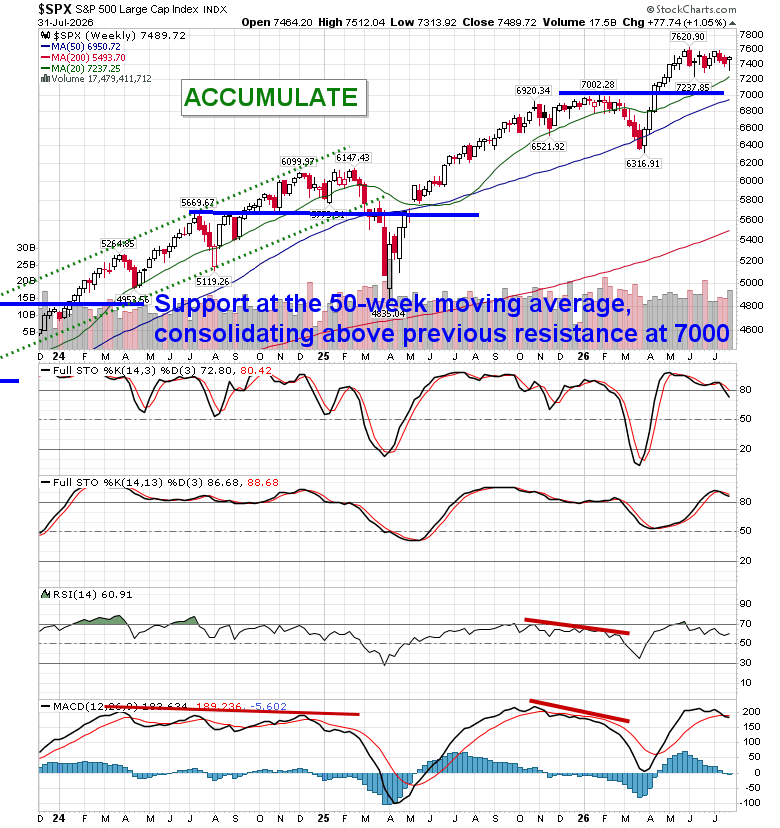
A rotation back towards growth stocks was enough to tack on further gains in the equity market on Friday, adding to Thursday’s solid returns. The S&P 500 Index added 0.70%, moving above the level of declining trendline resistance that has spanned the short-term peaks since the end of the summer rally phase on July 17th. The benchmark has filled the July 23rd downside gap between 7450 and 7500 and is back within the short-term trading range between 7425 and 7550. A zone of significant support has remained below between 7240 and 7300, but the bears lacked the strength to pull the benchmark down to this threshold. Implied resistance around 20 and 50-day moving averages (~7471) has been cracked, placing the ball in the bulls court heading into the start of the new month. Daily momentum indicators have started to curl higher again, although MACD remains on a sell signal that aligned with the end of the summer rally period that came to an end on July 17th. In the Seasonal Advantage Portfolio that we manage for clients at CastleMoore, we have not made any changes in our allocations, yet. Following a first half performance in the Seasonal Advantage Portfolio that was well ahead of our own benchmark (as well as all major equity benchmarks in the market), we still have a bias to expect strength for the start of the second half of the year, aligning with the optimism that the manufacturing economy is expressing, but we are scrutinizing the risks that have abruptly escalated with the increase in geopolitical tensions. We continue to view earnings season as providing some cover to the headline threats. Subscribers can view what we are targeting in our list of market segments to either Accumulate or Avoid.
As for the equity market tendency for the month ahead, August is a rather flat month for the S&P 500 Index in this last month of the meterolgical summer season. Over the past five decades, the large-cap benchmark has averaged a gain of a mere 0.2% in this eighth month of the year, which is the third weakest return on the calendar, lagging September’s 0.7% average drawdown and February’s unchanged result. Positive Augusts still outnumber negative ones with a gain frequency of 58%. Returns have ranged from a loss of 14.6% in August of 1998 to a gain of 11.6% in August of 1982. The range between the max gain and max loss is the second largest spread of the year, falling only behind October, a month that has become notorious for volatility. August is typically the month that investors have fully digested the release of second quarter earnings, which fuels escalating volatility through the month of September. Generally, lower trading volumes as traders take vacations and the lack of favourable fundamental catalysts in this late summer month tend to keep investors on their toes, that’s assuming they’ve stuck around to participate.
Just Released…
Our monthly report for August is out, providing you with everything that you need to know to navigate the market through the month(s) ahead.
Highlights in this report include:
- Equity market tendencies in the month of August
- Trading the period of seasonal volatility ahead
- Gold
- Dollar/Yield Threat
- Oil
- Market backdrop has yet to present the trigger to abandon risk
- Start of the optimal holding period for the bond market
- Manufacturers the most optimistic for July in over four decades
- Dividend Investing
- Our list of all segments of the market to either Accumulate or Avoid, along with relevant ETFs
- Positioning for the months ahead
- Sector Reviews and Ratings
- Stocks that have Frequently Gained in the Month of August
- Notable Stocks and ETFs Entering their Period of Strength in August
Subscribers can look for this 98-page report in their inbox and in the report archive.
Not signed up yet? Subscribe now to receive full access to all of the research and analysis that we publish
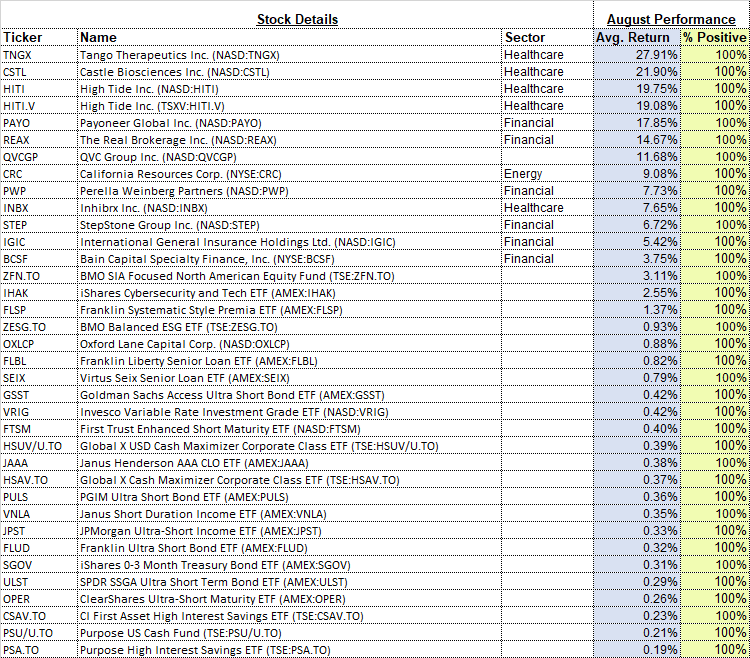
With the new month upon us and as we celebrate the release of our monthly report for August, today we release our screen of all of the stocks that have gained in every August over their trading history. While we at Equity Clock focus on a three-pronged approach (seasonal, technical, and fundamental analysis) to gain exposure to areas of the market that typically perform well over intermediate (2 to 6 months) timeframes, we know that stocks that have a 100% frequency of success for a particular month is generally of interest to those pursuing a seasonal investment strategy. Below are the results:
And how about those securities that have never gained in this eighth month of the year, here they are:
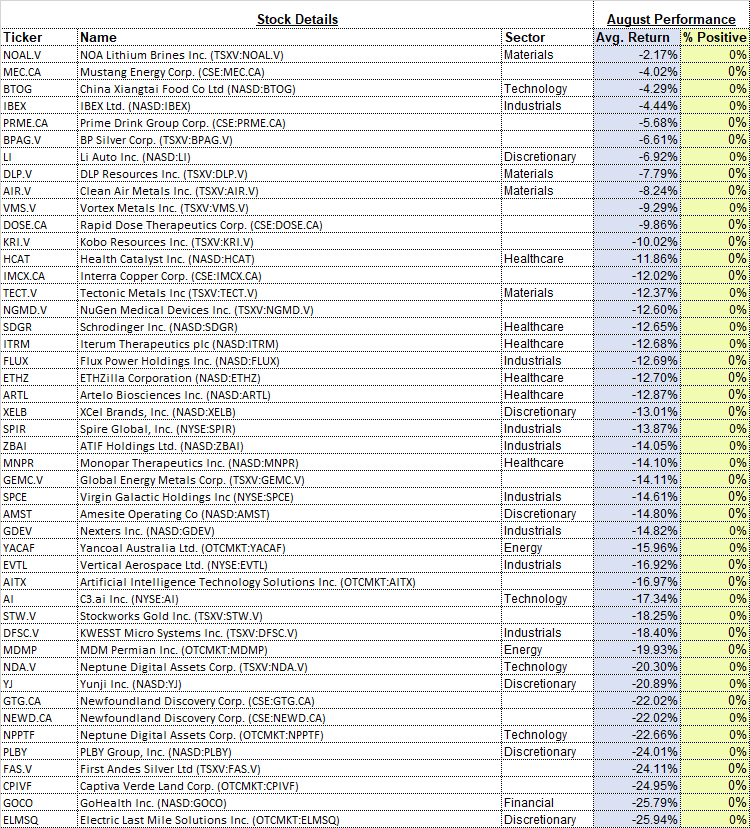
*Note: None of the results highlighted above have the 20 years of data that we like to see in order to accurately gauge the annual recurring, seasonal influences impacting an investment, therefore the reliability of the results should be questioned. We present the above list as an example of how our downloadable spreadsheet available to yearly subscribers can be filtered. For a more extensive list of high frequency (70% ) gainers for the month of August, please refer to our monthly report.
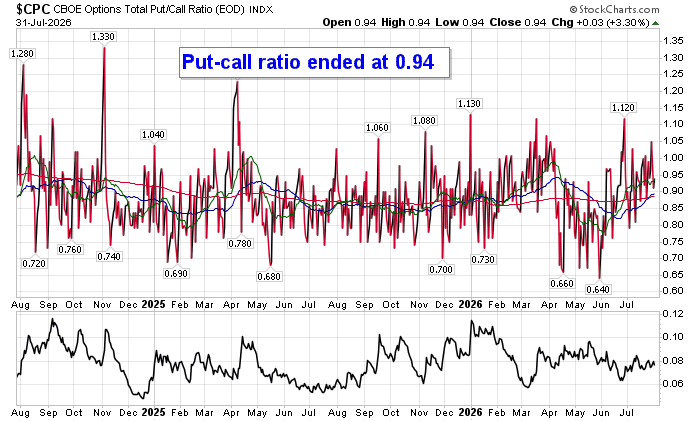
Sentiment on Friday, as gauged by the put-call ratio, ended close to neutral at 0.94.
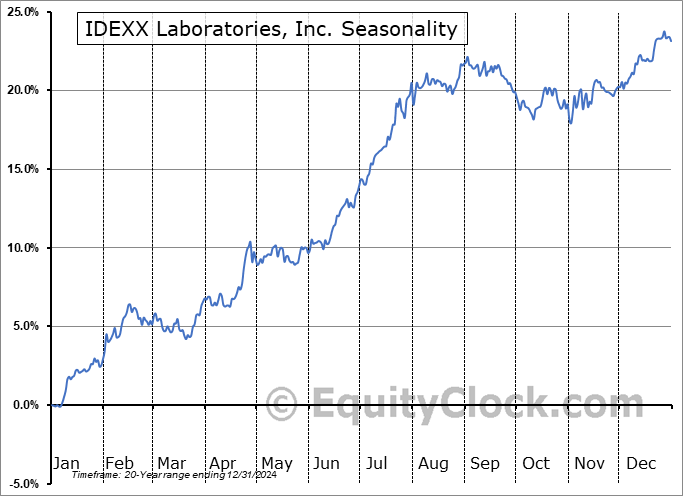
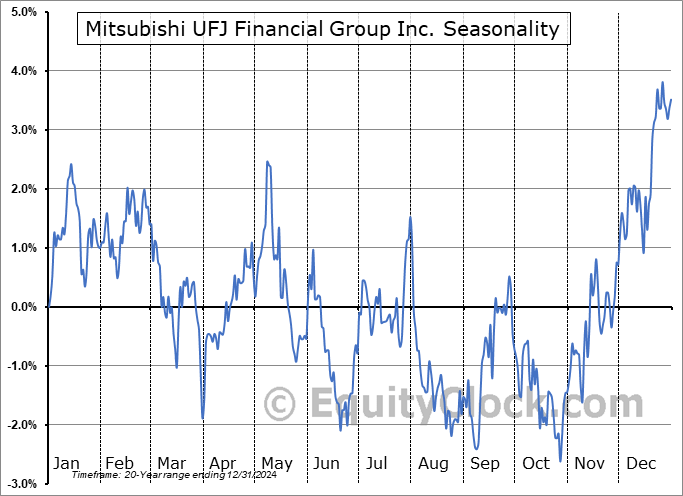
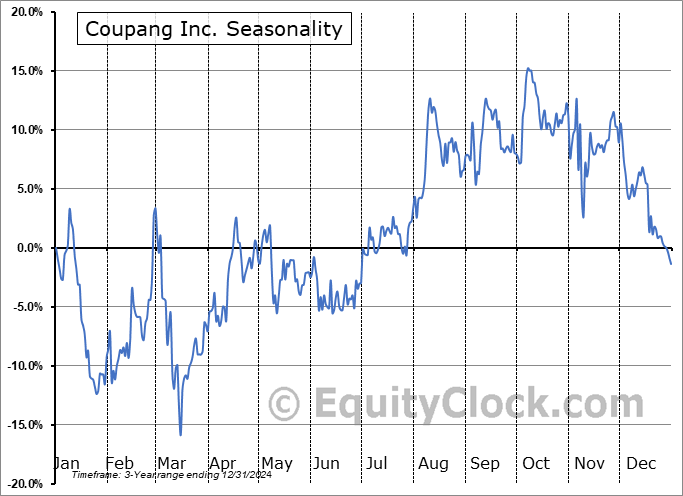
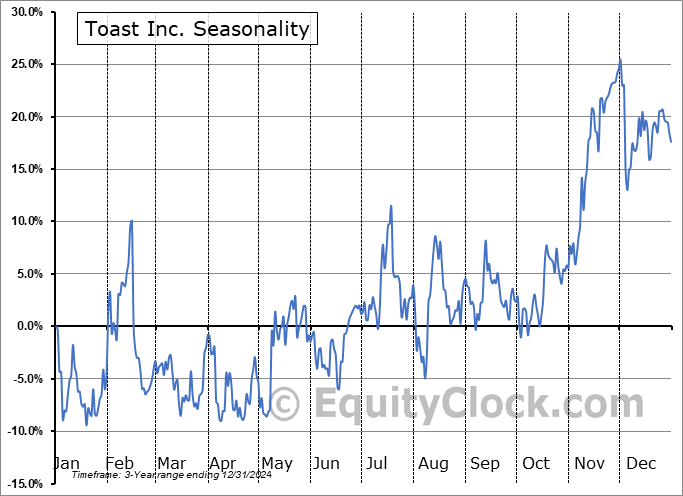
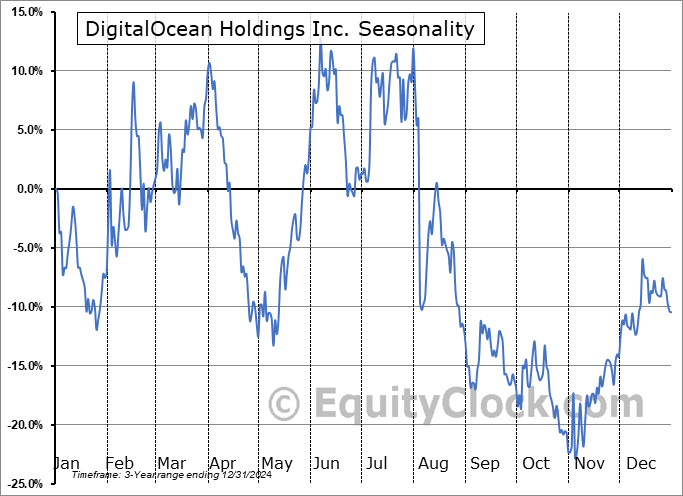
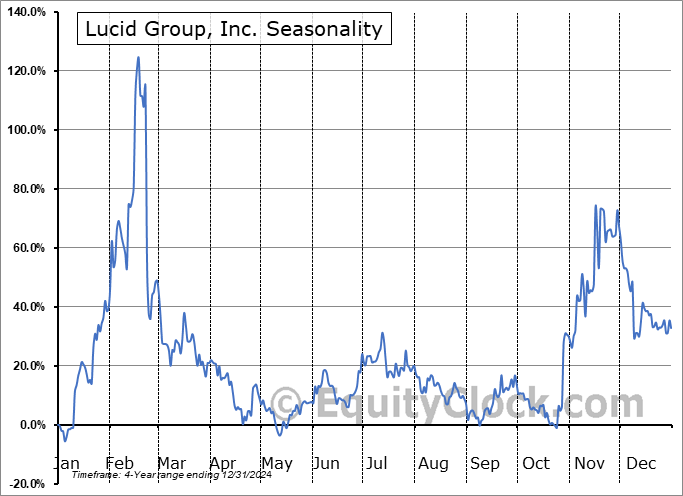
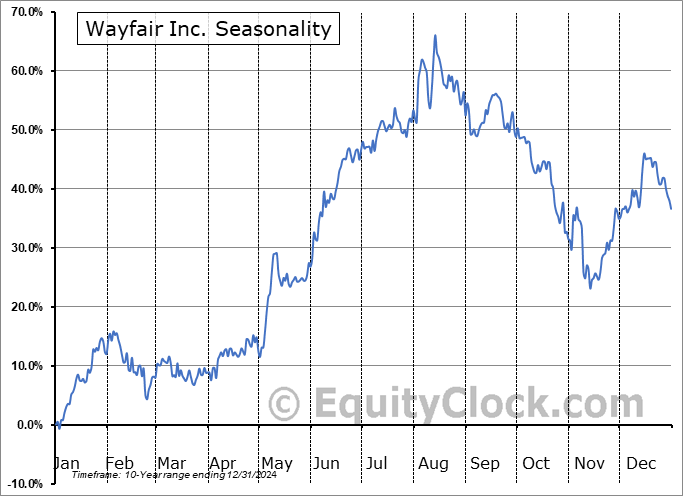
Seasonal charts of companies reporting earnings today:








S&P 500 Index
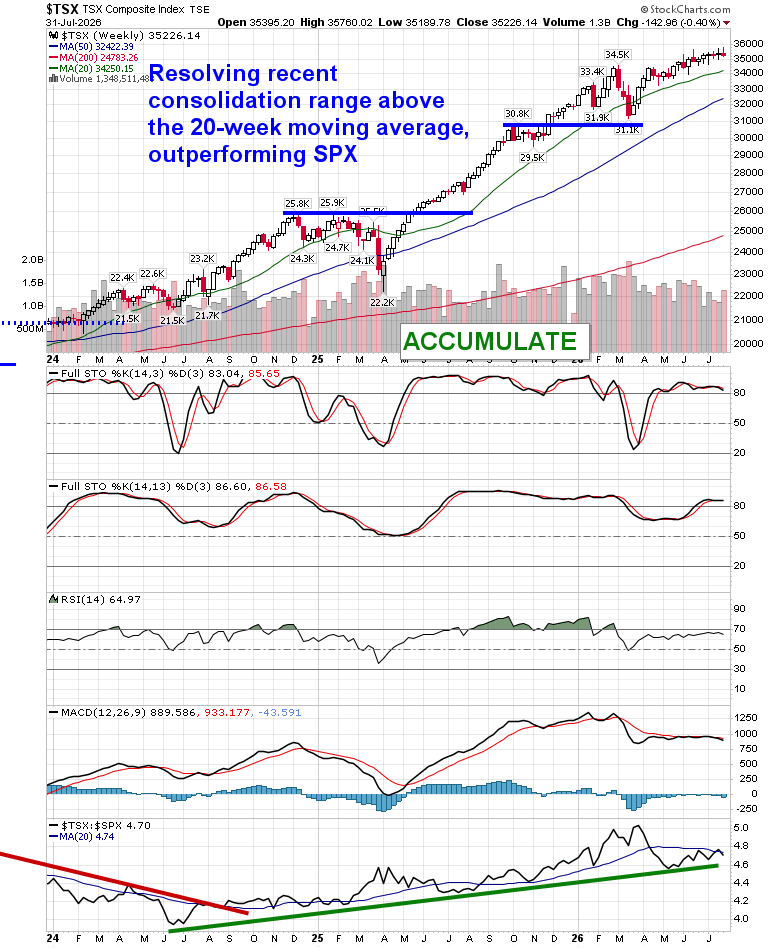
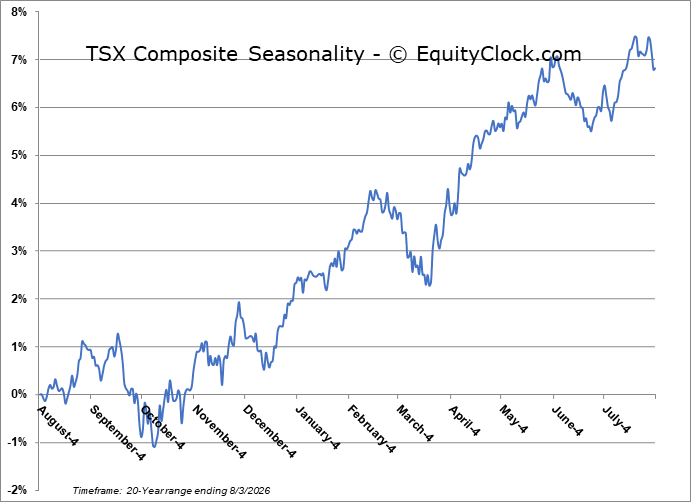
TSE Composite
| Sponsored By... |

|


