Stock Market Outlook for September 25, 2026

Sell Oil and Buy Natural Gas.
*** Stocks highlighted are for information purposes only and should not be considered as advice to purchase or to sell mentioned securities. As always, the use of technical and fundamental analysis is encouraged in order to fine tune entry and exit points to average seasonal trends.
Stocks Entering Period of Seasonal Strength Today:
Subscribers Click on the relevant link to view the full profile. Not a subscriber? Signup here.
Stock Highlight: |
|

Generac Holdings Inc. (NYSE:GNRC) Seasonal Chart |
|

SPDR Russell 1000 Yield Focus ETF (AMEX:ONEY) Seasonal Chart

ProShares Russell 2000 Dividend Growers ETF (NYSE:SMDV) Seasonal Chart

US Global Jets ETF (AMEX:JETS) Seasonal Chart

KLX Energy Services Holdings, Inc. (NASD:KLXE) Seasonal Chart

Acuity Brands, Inc. (NYSE:AYI) Seasonal Chart
Disclaimer: Comments and opinions offered in this report are for information only. They should not be considered as advice to purchase or to sell mentioned securities. Data offered is believed to be accurate, but is not guaranteed.
The Markets
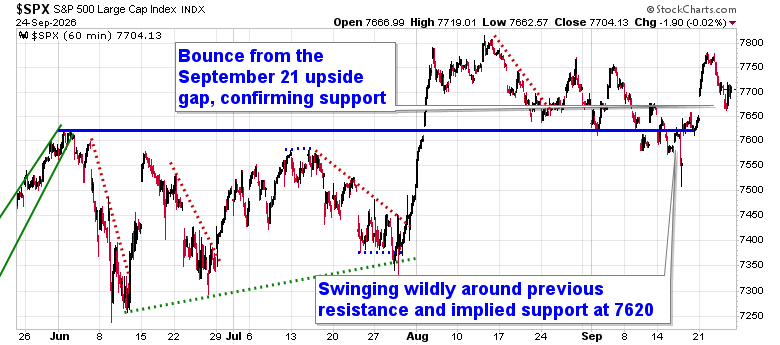
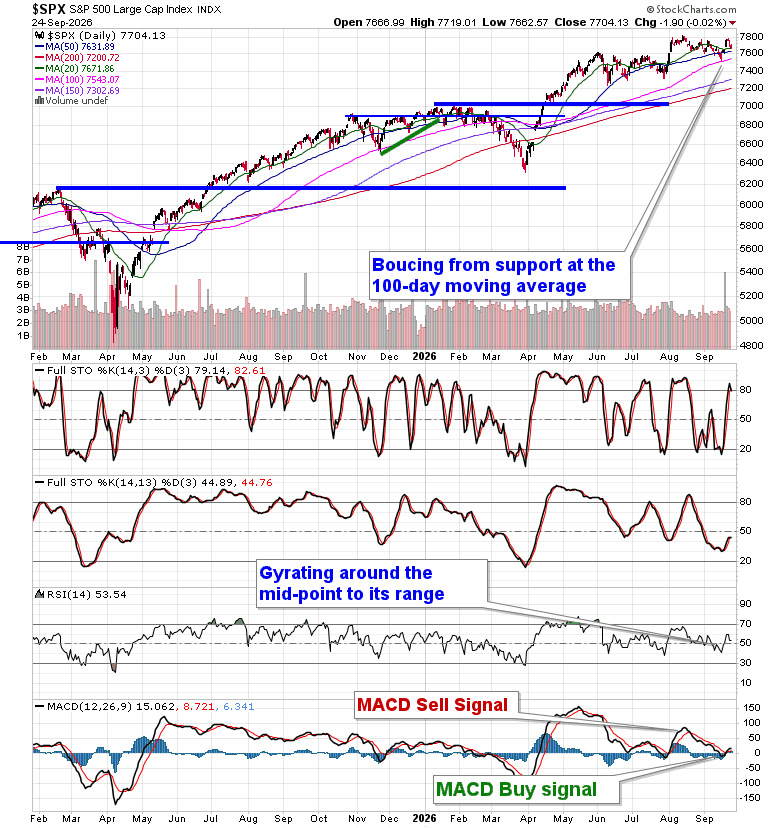
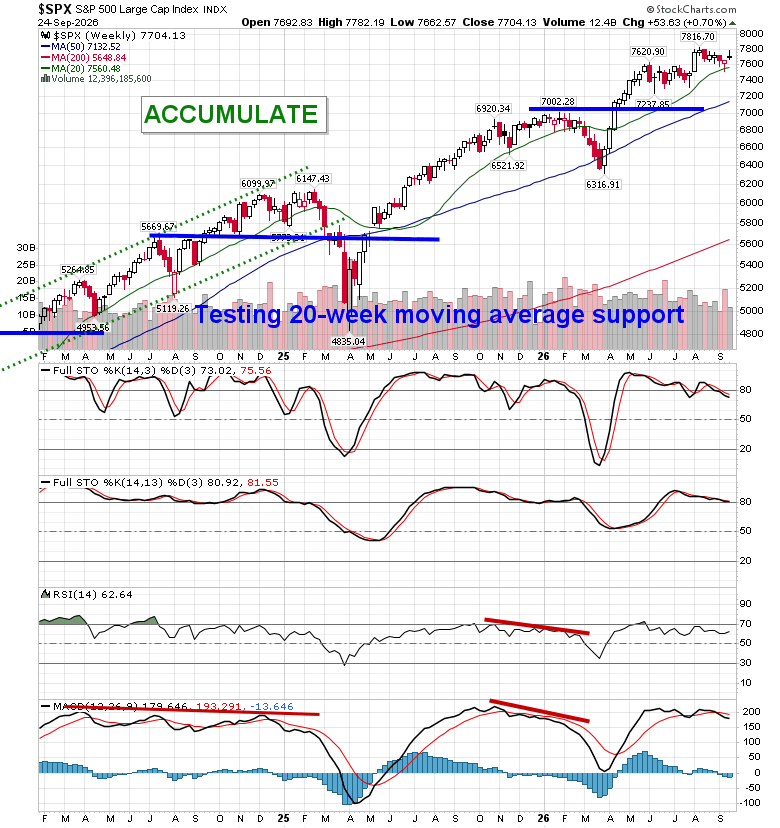
An ongoing rise in interest rates kept stocks under pressure during the Thursday session, although major equity markets ended well off of the lows of the session. The S&P 500 Index was essentially unchanged, down by 0.02%, rebounding from from the upside open gap (a zone of support) charted on Monday between 7650 and 7690. Previous resistance remains as implied support at 7620. The ultra-short-term trend of lower-highs and lower-lows that has dominated since the middle of August is still deemed to be broken as we look for the potential for a short-term head-and-shoulders pattern to form through the days ahead. The 100-day moving average (7543) has proven itself as support, drawing in the buyers to keep the intermediate-term trajectory of the market afloat. Momentum indicators are curling higher with MACD triggering a fresh buy signal on Monday. Historically, the most volatile period for equity performance dominates at this time of year, therefore heightened caution has been appropriate, but the way we have desired to position for this negative timeframe does not follow the typical seasonal script (see our September 18th report). In the Seasonal Advantage Portfolio that we manage for clients at CastleMoore, we continue to be fully allocated to stocks, aligning with the optimism that the manufacturing economy is expressing and we are being rewarded for our patience. Subscribers can view what we are targeting in our list of market segments to either Accumulate or Avoid.
Today, in our Market Outlook to subscribers, we discuss the following:
- Natural Gas
- Weekly Jobless Claims
- US New Home Sales
- Additional Thoughts
Subscribers can look for this report in their inbox or by clicking on the following link and logging in: Market Outlook for September 25
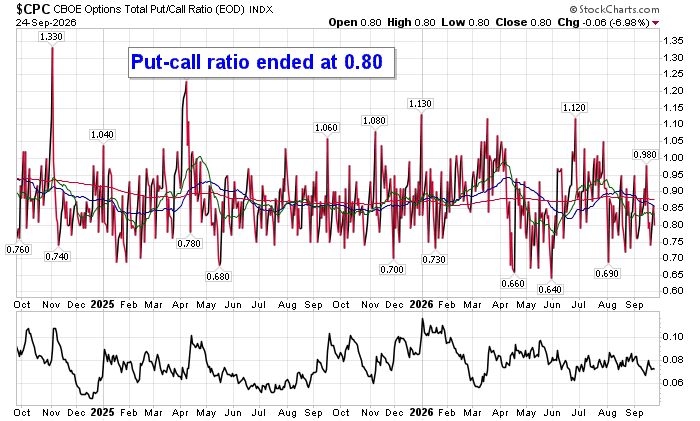
Sentiment on Thursday, as gauged by the put-call ratio, ended bullish at 0.80.
Seasonal charts of companies reporting earnings today:
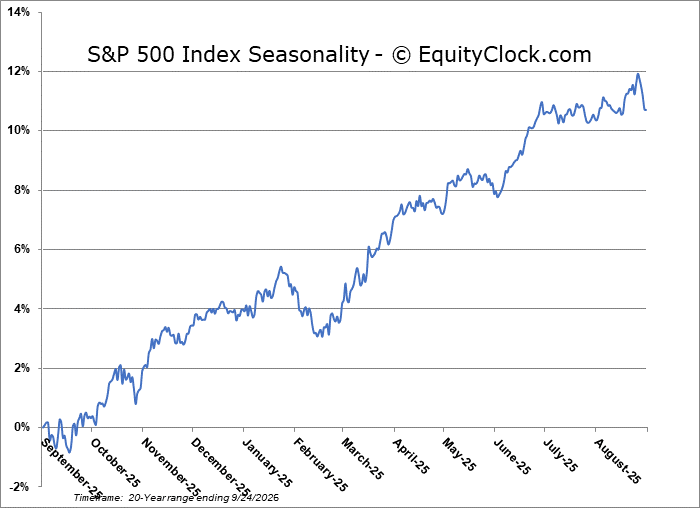
S&P 500 Index
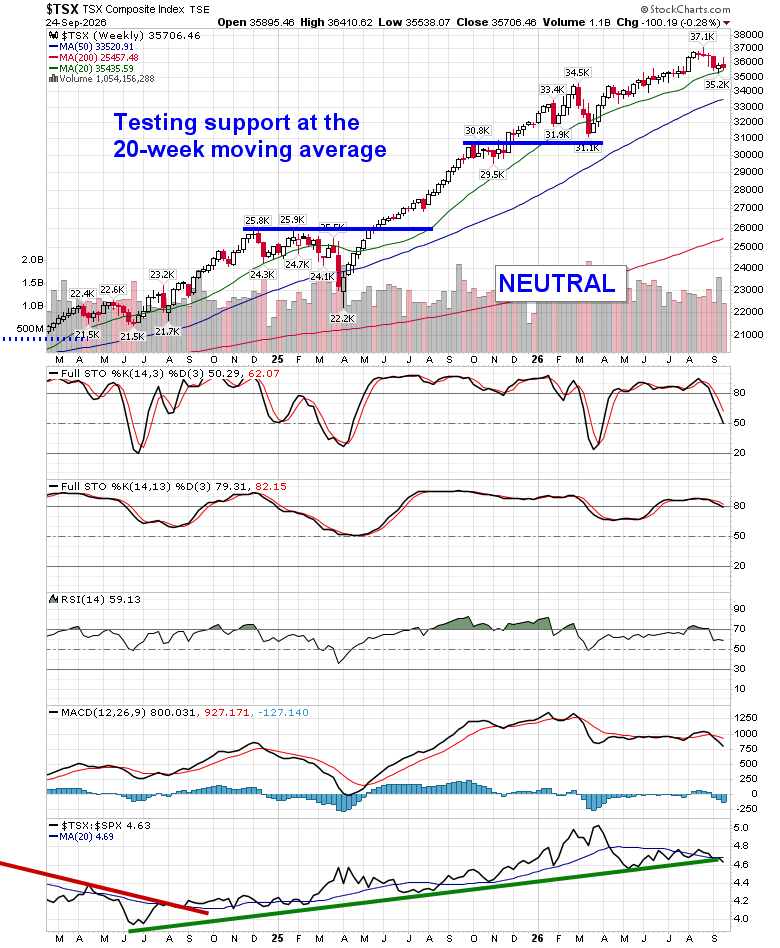
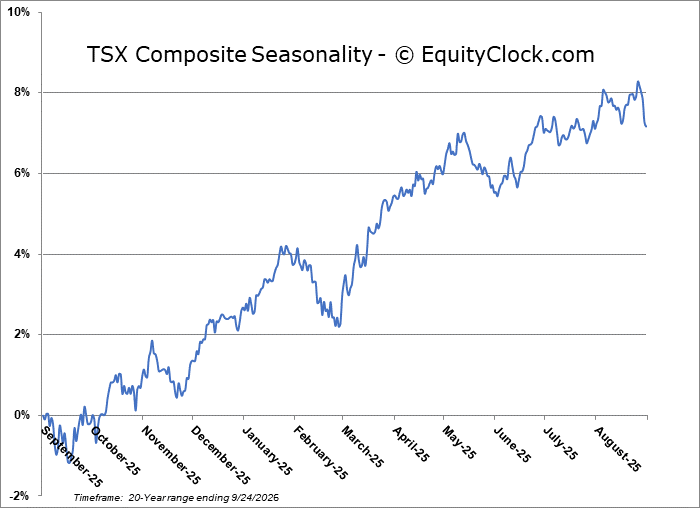
TSE Composite
| Sponsored By... |

|


