Stock Market Outlook for October 27, 2026

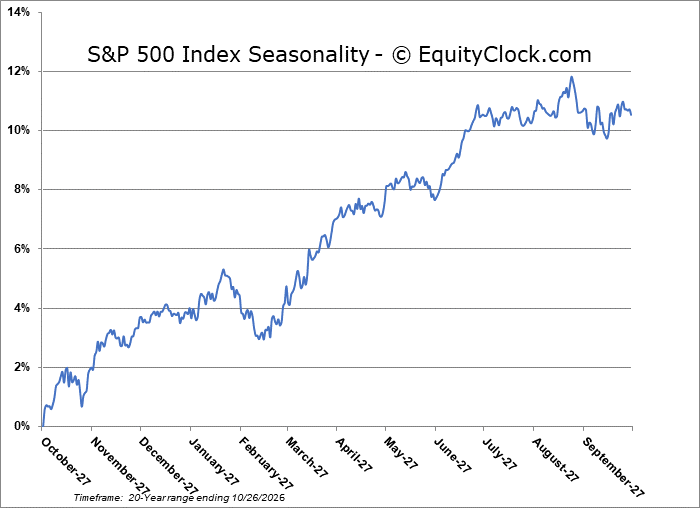
This period surrounding the Mid-Term Election is typically strongly positive for stocks.
*** Stocks highlighted are for information purposes only and should not be considered as advice to purchase or to sell mentioned securities. As always, the use of technical and fundamental analysis is encouraged in order to fine tune entry and exit points to average seasonal trends.
Stocks Entering Period of Seasonal Strength Today:
Subscribers Click on the relevant link to view the full profile. Not a subscriber? Signup here.

iShares Core S&P Mid-Cap ETF (NYSE:IJH) Seasonal Chart

Invesco S&P SmallCap Health Care ETF (NASD:PSCH) Seasonal Chart

Vanguard S&P 500 Value ETF (NYSE:VOOV) Seasonal Chart

iShares U.S. Healthcare Providers ETF (NYSE:IHF) Seasonal Chart

Invesco S&P SmallCap High Dividend Low Volatility ETF (AMEX:XSHD) Seasonal Chart

Defiance Quantum ETF (NASD:QTUM) Seasonal Chart

Dover Corp. (NYSE:DOV) Seasonal Chart

Eaton Corp. (NYSE:ETN) Seasonal Chart

Lincoln Electric Holdings, Inc. (NASD:LECO) Seasonal Chart

Tenaris SA (NYSE:TS) Seasonal Chart

Allegion Public Ltd. Co. (NYSE:ALLE) Seasonal Chart
Disclaimer: Comments and opinions offered in this report are for information only. They should not be considered as advice to purchase or to sell mentioned securities. Data offered is believed to be accurate, but is not guaranteed.
The Markets
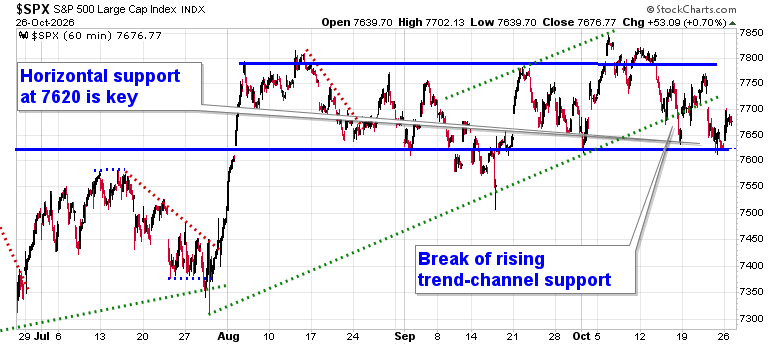
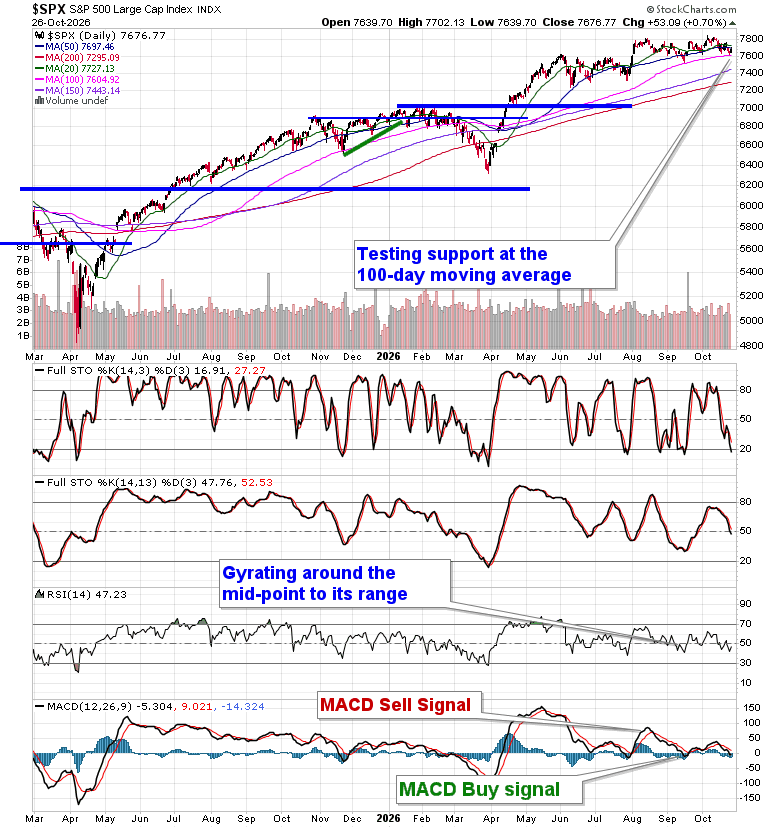
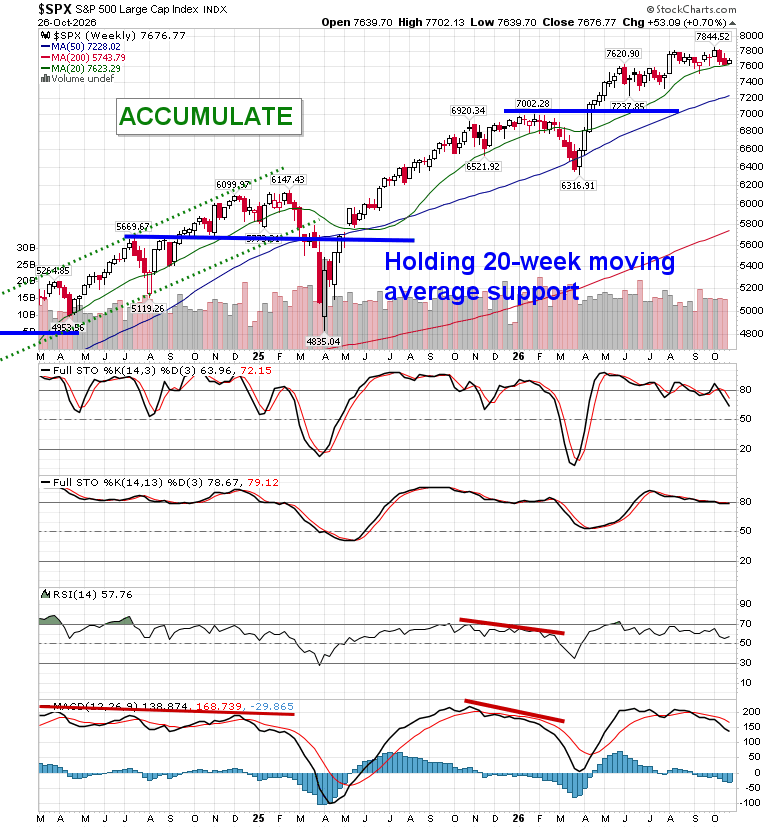
Ongoing rotation in the market favored the technology sector on Monday, giving lift to the tech-heavy S&P 500 Index to start the week. The S&P 500 Index gained seven-tenths of one percent, reaching back to the midpoint of the range that the benchmark has been in since August between 7620 and 7800. Downside gap resistance charted on October 22nd around 7730 is one to watch as a rejection here would increase the likelihood that the head-and-shoulders pattern on the hourly chart is fulfilled. A breakdown below the neckline of the setup, at the lower limit of the span, would propose a downside target of 7400, or back to the July lows. The sloppiness of the tape in recent days and the concerns that the credit market is showing suggest continued vulnerability, despite the equity market being at a major turning point in the seasonal timeline from weakness to strength for the next six months. 20 and 50-day moving averages are no longer defining support and the 100-day moving average is the last line of defense before a more substantial correction is triggered. Weakening support raises concerns for the health of stocks moving forward. As noted in our recent chart books, there are segments following recent price action that we no longer want to be exposed to, but the market has provided rotation opportunities that allow us to maintain our overall equity exposure. Members can stay on top of our thinking and what we are watching in our regular reports, as well as view what we are targeting in our list of market segments to either Accumulate or Avoid
Want to know which areas of the market to buy or sell? Our Weekly Chart Books have just been updated, providing a clear Accumulate, Avoid, or Neutral rating for currencies, cryptocurrencies, commodities, broad markets, and subsectors/industries of the market. Subscribers can login and click on the relevant links to access.
- Currencies
- Cryptocurrencies
- Commodities
- Major Benchmarks
- Sub-sectors / Industries
- ETFs: Bonds | Commodities | Equity Markets | Industries | Sectors
Today, in our Market Outlook to subscribers, we discuss the following:
- Our weekly chart books update, along with our list of all segments of the market to Accumulate or Avoid
- Other Notes
- Additional Thoughts (Communications Services at 52-week lows, bounce in Technology and the key level to watch)
Subscribers can look for this report in their inbox or by clicking on the following link and logging in: Market Outlook for October 27
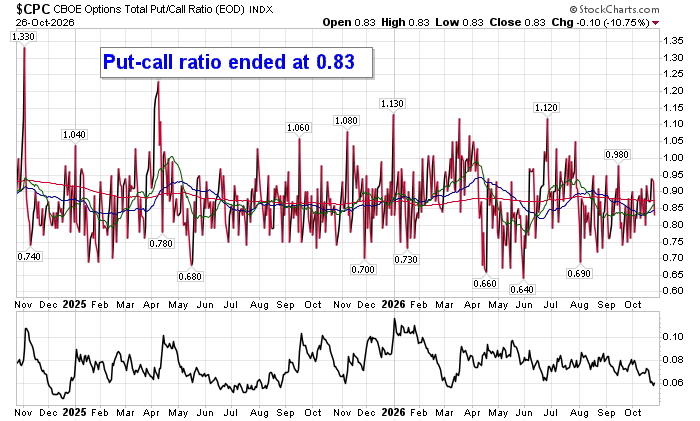
Sentiment on Monday, as gauged by the put-call ratio, ended bullish at 0.83.
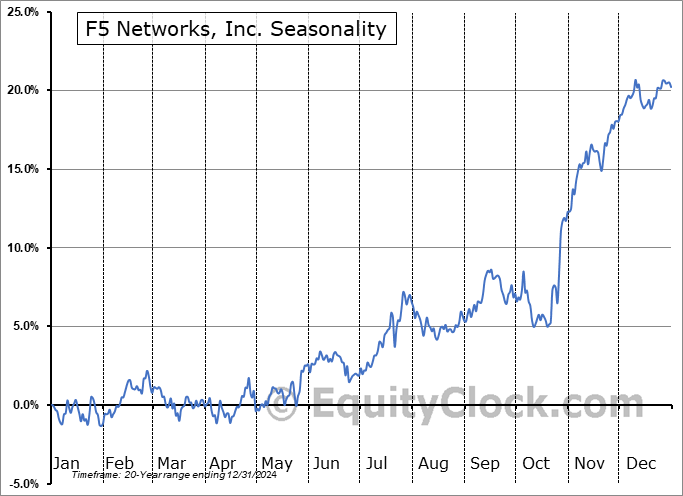
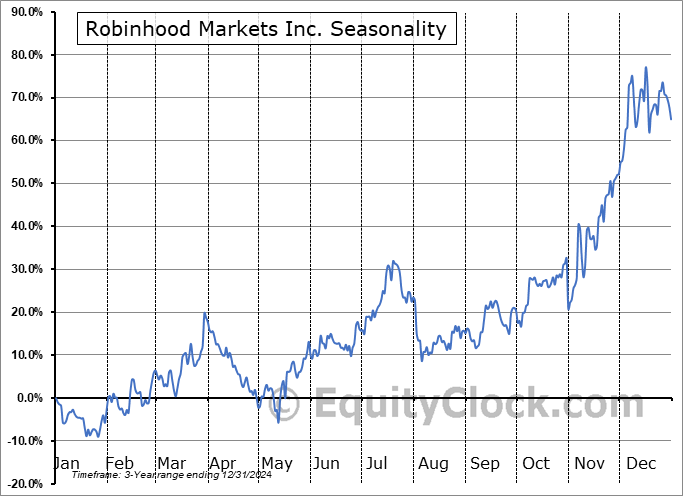
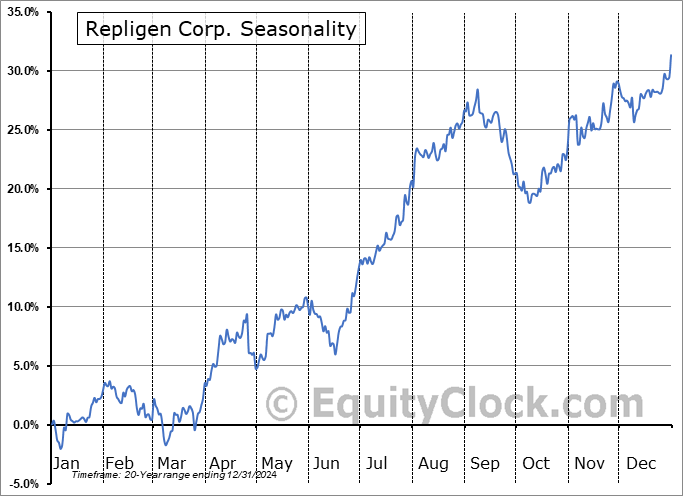
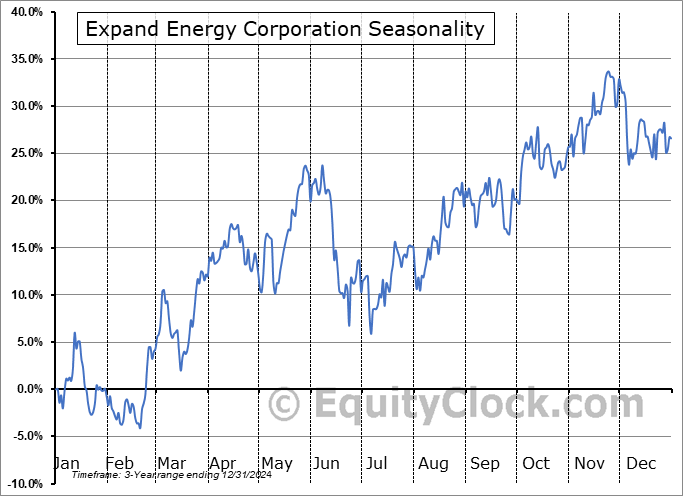
Seasonal charts of companies reporting earnings today:








S&P 500 Index
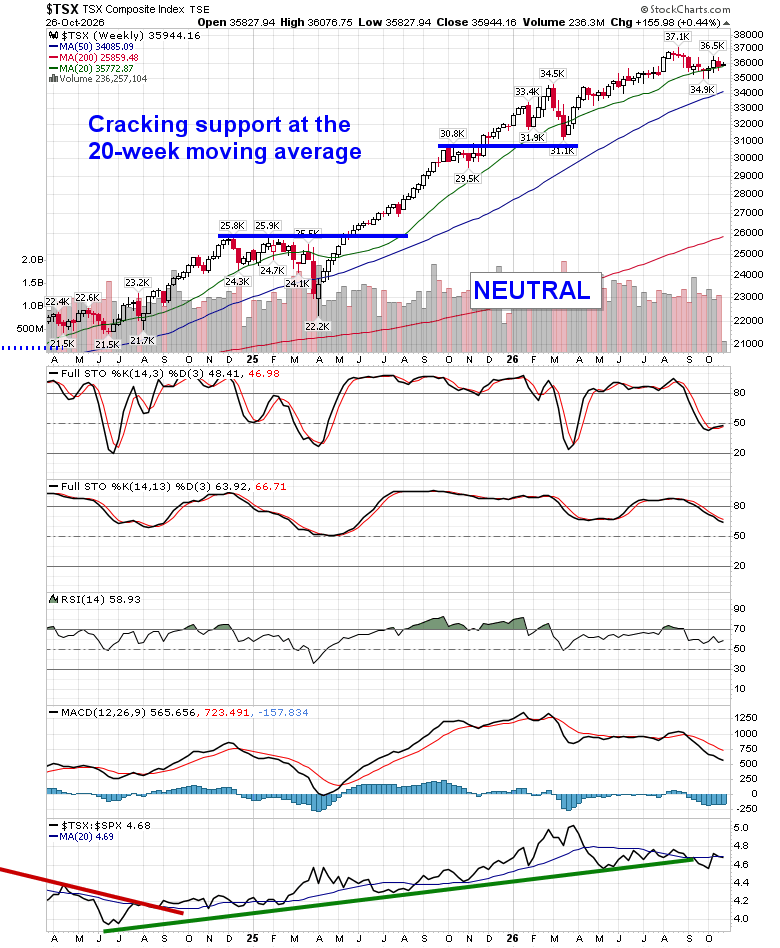
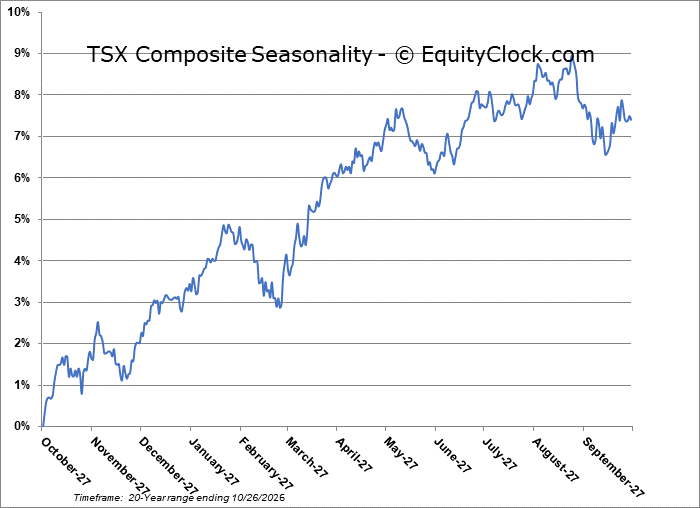
TSE Composite
| Sponsored By... |

|


