Stock Market Outlook for October 29, 2026

The rise in the Dollar, Rates, and Oil remain the primary risks against the market heading into the seasonally strong phase for stocks through the next six months.
*** Stocks highlighted are for information purposes only and should not be considered as advice to purchase or to sell mentioned securities. As always, the use of technical and fundamental analysis is encouraged in order to fine tune entry and exit points to average seasonal trends.
Stocks Entering Period of Seasonal Strength Today:
Subscribers Click on the relevant link to view the full profile. Not a subscriber? Signup here.

Invesco Dynamic Leisure and Entertainment ETF (NYSE:PEJ) Seasonal Chart

iShares Semiconductor ETF (NASD:SOXX) Seasonal Chart

Invesco S&P 500 Equal Weight Materials ETF (AMEX:RSPM) Seasonal Chart

Gentherm Inc. (NASD:THRM) Seasonal Chart

Quanex Corp. (NYSE:NX) Seasonal Chart

Southwest Airlines Co. (NYSE:LUV) Seasonal Chart

iShares U.S. Industrials ETF (NYSE:IYJ) Seasonal Chart

iShares S&P/TSX Capped Information Technology Index ETF (TSE:XIT.TO) Seasonal Chart

L3Harris Technologies Inc. (NYSE:LHX) Seasonal Chart
Disclaimer: Comments and opinions offered in this report are for information only. They should not be considered as advice to purchase or to sell mentioned securities. Data offered is believed to be accurate, but is not guaranteed.
The Markets
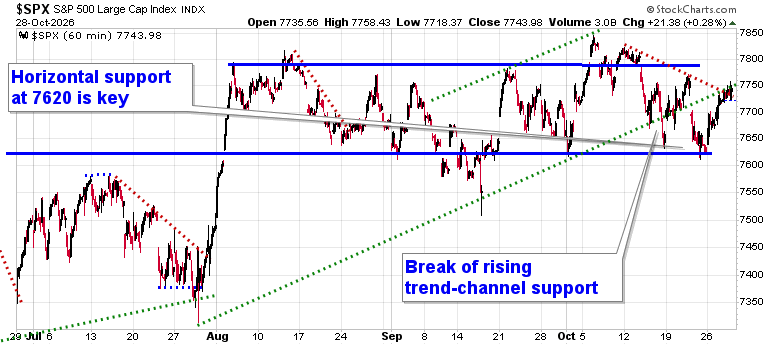
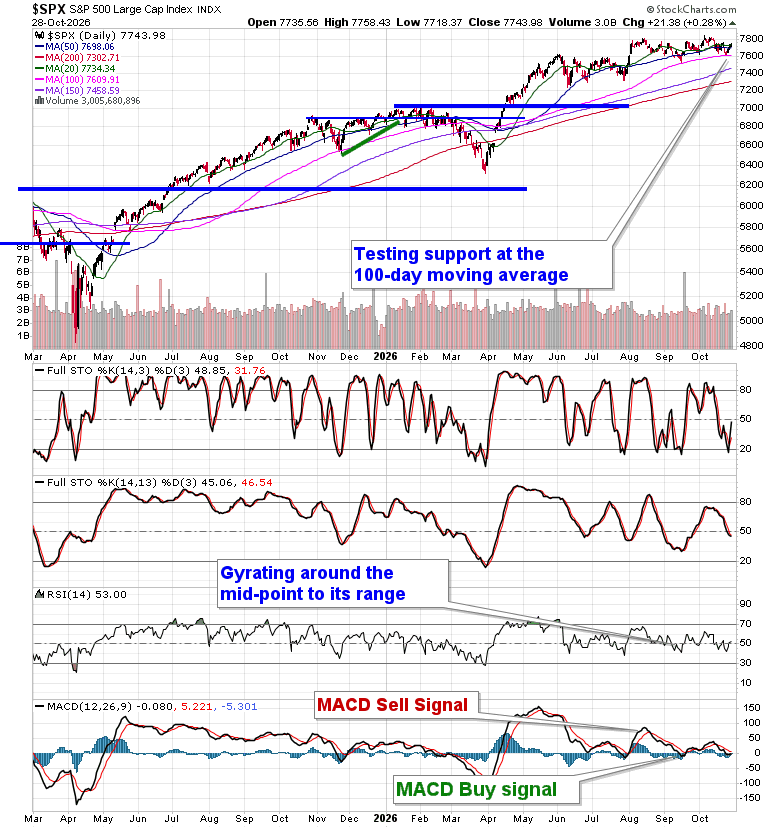
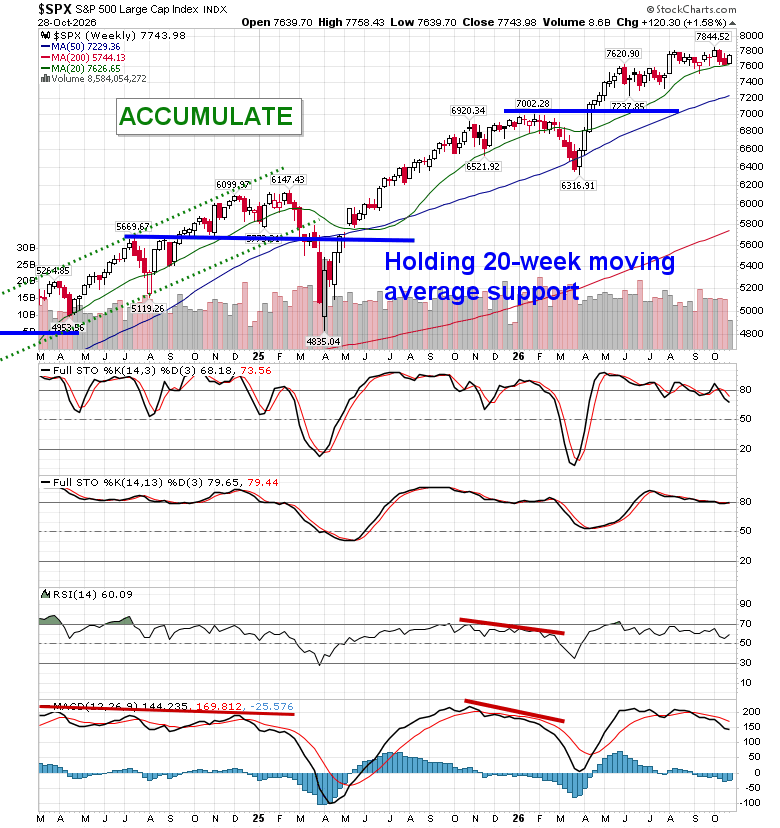
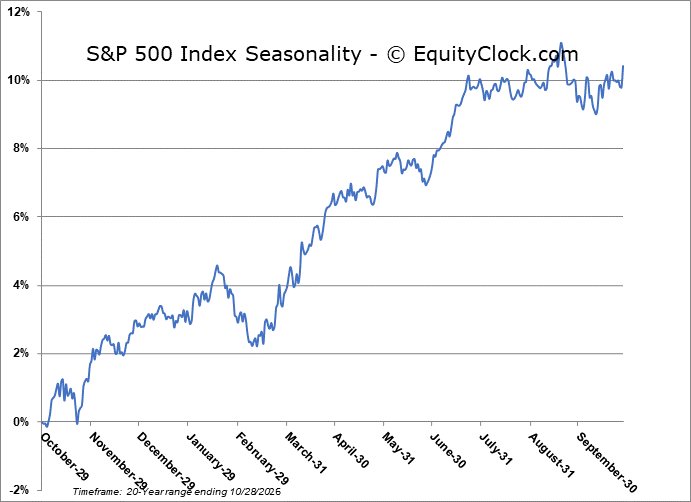
Stocks closed slightly positive on Wednesday as the FOMC left rates unchanged with the view that they will let further data dictate the policy rate moving forward. The S&P 500 Index gained just less than three-tenths of one percent, continuing to reach back to the midpoint of the range that the benchmark has been in since August between 7620 and 7800. Downside gap resistance charted on October 22nd around 7730 was cracked, although the move was far from definitive. Ultimately a sideways range persists, but we continue to scrutinize the risks that the head-and-shoulders setup on the hourly chart presents. The sloppiness of the tape in recent days and the concerns that the credit market is showing suggest continued vulnerability, despite the equity market being at a major turning point in the seasonal timeline from weakness to strength for the next six months. 20 and 50-day moving averages are no longer defining support and the 100-day moving average is the last line of defense before a more substantial correction is triggered. Weakening support raises concerns for the health of stocks moving forward. As noted in our recent chart books, there are segments following recent price action that we no longer want to be exposed to, but the market has provided rotation opportunities that allow us to maintain our overall equity exposure. Members can stay on top of our thinking and what we are watching in our regular reports, as well as view what we are targeting in our list of market segments to either Accumulate or Avoid
Today, in our Market Outlook to subscribers, we discuss the following:
- Interest Rates and Dollar headwinds
- The jump in shares of neocloud companies
- Semiconductors and Technology
- South Korea
- US International Trade, the third largest monthly deficit on record, and the investment implications within
- Petroleum Supply/Demand and the price of Oil
Subscribers can look for this report in their inbox or by clicking on the following link and logging in: Market Outlook for October 29
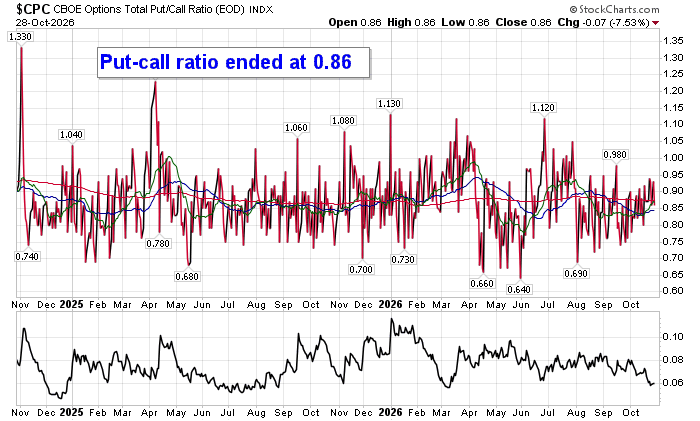
Sentiment on Wednesday, as gauged by the put-call ratio, ended bullish at 0.86.
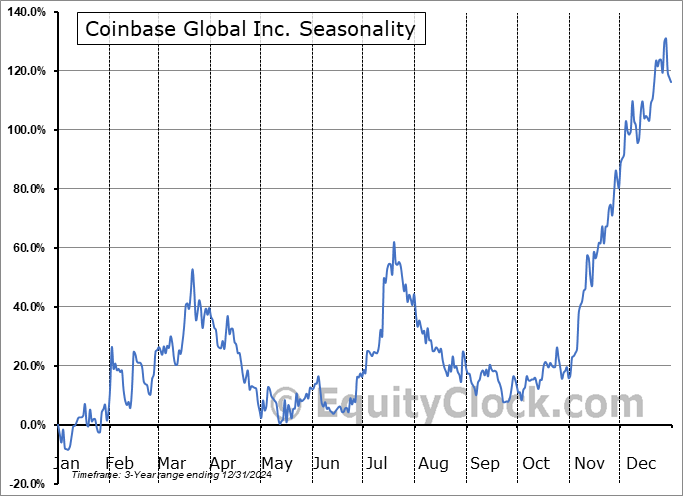
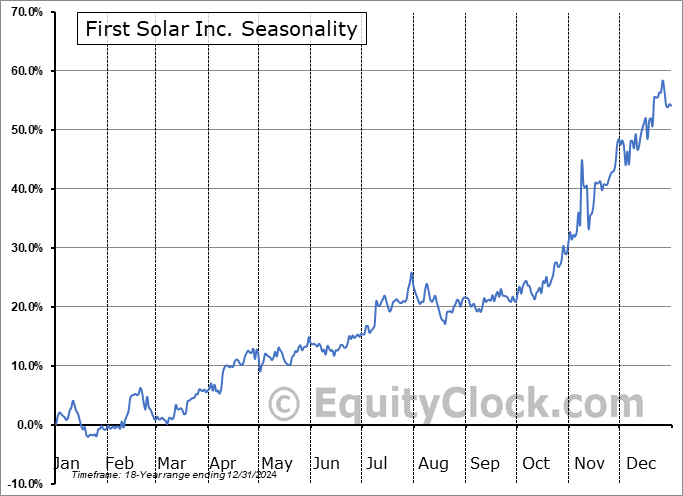
Seasonal charts of companies reporting earnings today:






S&P 500 Index
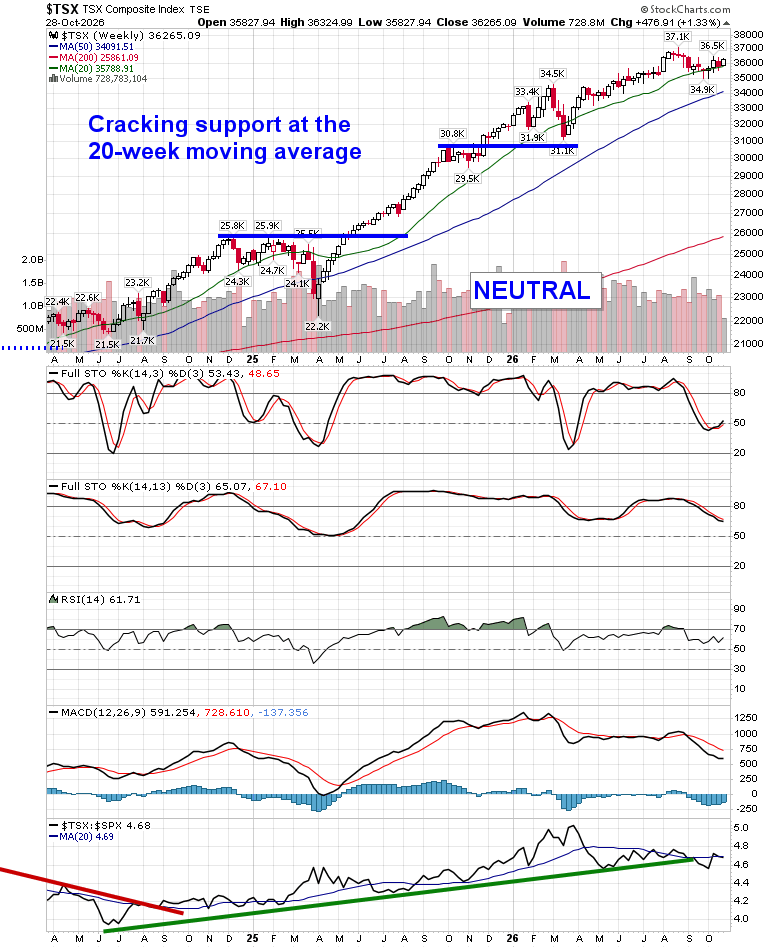
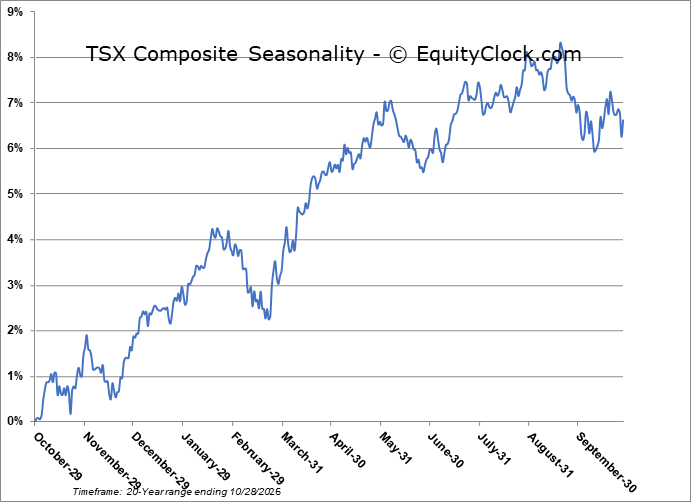
TSE Composite
| Sponsored By... |

|


