Stock Market Outlook for March 5, 2026

Gap Filled, But Risk Builds: 100-Day Moving Average Is the Line in the Sand
*** Stocks highlighted are for information purposes only and should not be considered as advice to purchase or to sell mentioned securities. As always, the use of technical and fundamental analysis is encouraged in order to fine tune entry and exit points to average seasonal trends.
Stocks Entering Period of Seasonal Strength Today:
Subscribers Click on the relevant link to view the full profile. Not a subscriber? Signup here.

John Wiley & Sons, Inc. (NYSE:WLY) Seasonal Chart
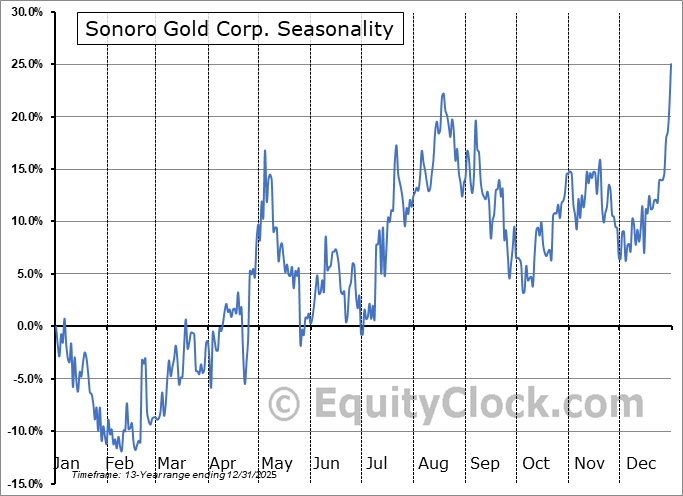
Sonoro Gold Corp. (TSXV:SGO.V) Seasonal Chart
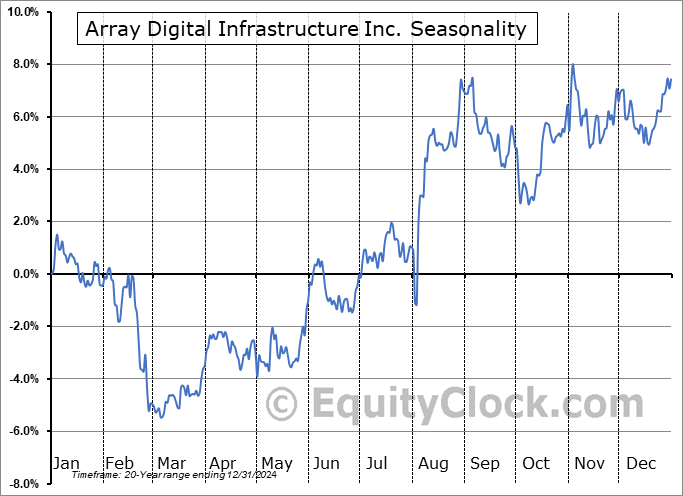
Array Digital Infrastructure Inc. (NYSE:AD) Seasonal Chart

Avient Corporation (NYSE:AVNT) Seasonal Chart

Mitek Systems, Inc. (NASD:MITK) Seasonal Chart

KB Financial Group, Inc. (NYSE:KB) Seasonal Chart

Cal-Maine Foods, Inc. (NASD:CALM) Seasonal Chart
Disclaimer: Comments and opinions offered in this report are for information only. They should not be considered as advice to purchase or to sell mentioned securities. Data offered is believed to be accurate, but is not guaranteed.
The Markets
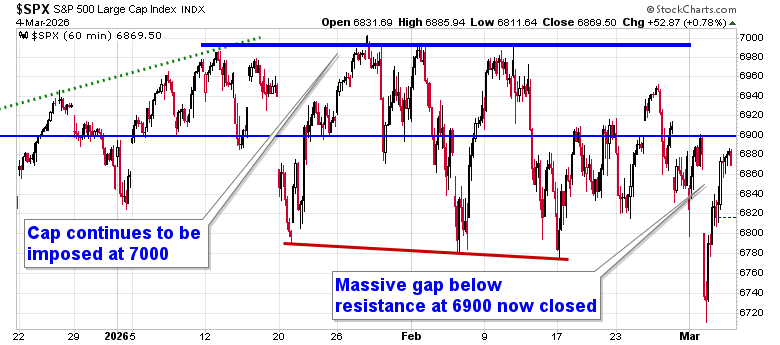
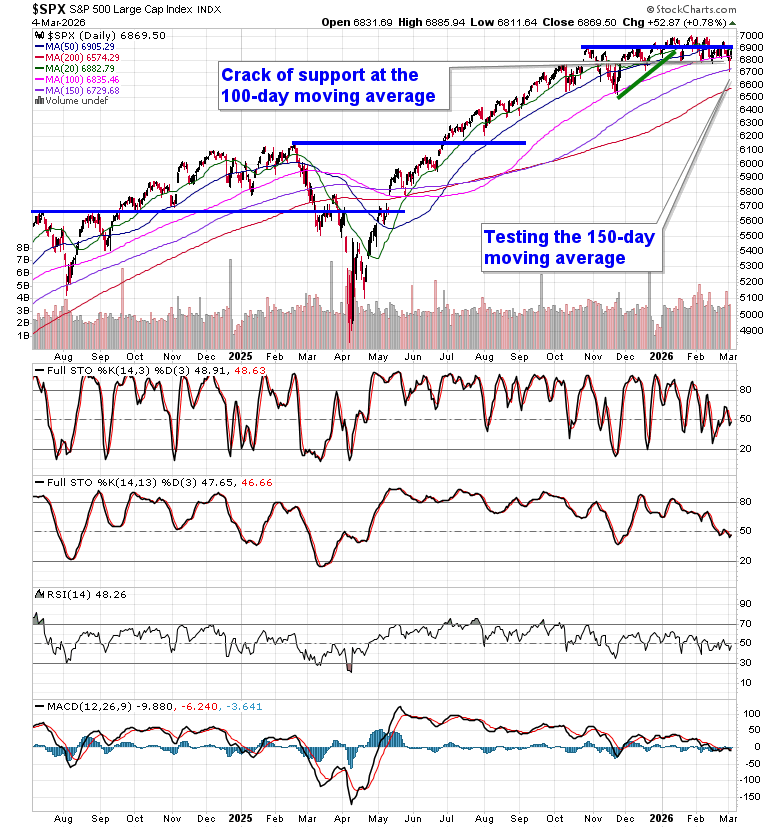
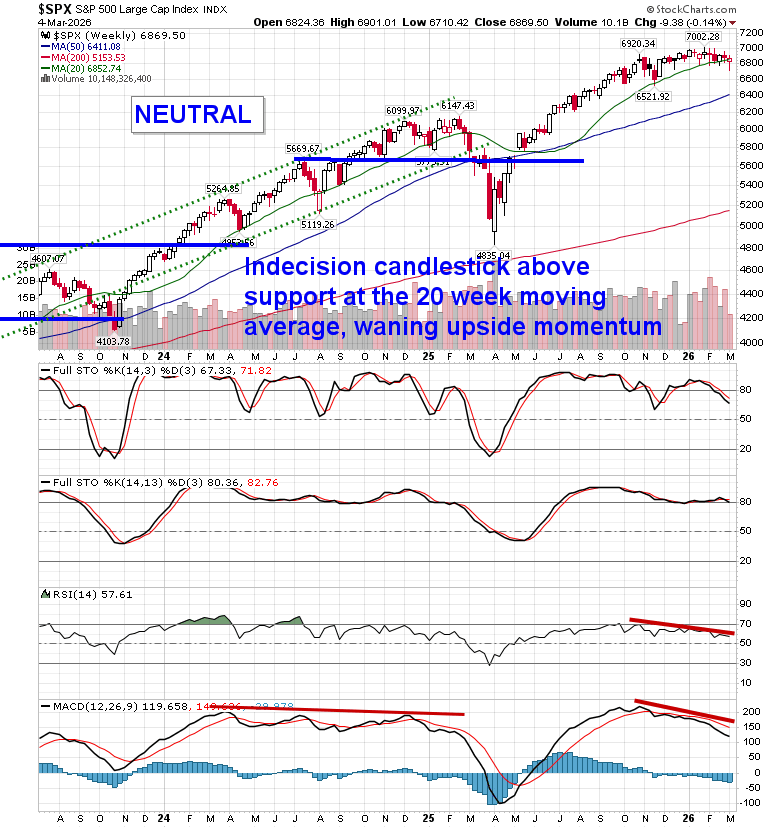
Stocks recovered on Wednesday as traders rotated back into the growth/technology names that have struggled to gain traction this year. The S&P 500 Index gained just less than eight-tenths of one percent, closing the substantial gap below the important 6900 pivot point that we have highlighted in our reporting. Levels of resistance overhead remain heavy and there is certainly no evidence that selling pressures have concluded. The 100-day moving average for the large-cap benchmark (6835) that was providing significant support has been cracked, putting the 150-day and 200-day moving averages in play (6729 and 6574, respectively). A sustained break of horizontal support around 6800 would violate an approximately 200-point range from the last few months, proposing a downside target of 6600. While Wednesday’s strength is certainly welcoming, it is difficult to conclude, for now, that it is anything but a gap fill. In the Seasonal Advantage Portfolio that we manage for clients at CastleMoore, we have been balancing the near-term risk-reward in the market, barbelling low volatility plays with pro-cyclical/commodity oriented bets, an approach that continues to be viewed as the most appropriate allocation at the present time. Subscribers can view the themes in our chart books to either Accumulate or Avoid that are working and intact.
Today, in our Market Outlook to Subscribers, we discuss the following:
- Equity Market: Bounce, But No All-Clear
- Energy & Oil: Neutral Bias Emerging
- Bitcoin: Major Technical Test Underway
- Consumer & Manufacturing Warning Signs
- Auto Sector: Seasonal & Technical Headwinds
- Big Picture Takeaways
Subscribers can look for this report in their inbox or by clicking on the following link and logging in: Market Outlook for March 5
Not signed up yet? Subscribe now to receive full access to all of the research and analysis that we publish
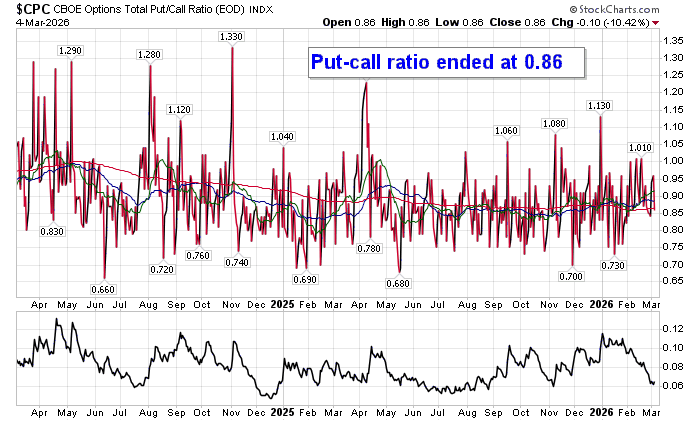
Sentiment on Wednesday, as gauged by the put-call ratio, ended bullish at 0.86.
Seasonal charts of companies reporting earnings today:


 Limited Sponsored... Seasonal Chart")


S&P 500 Index
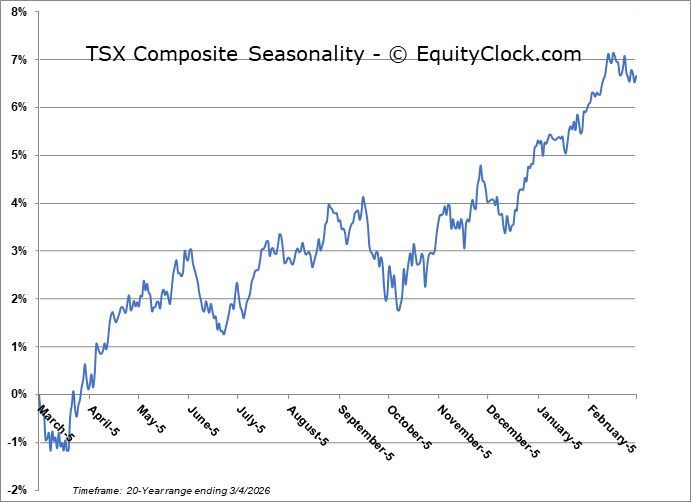
TSE Composite
| Sponsored By... |

|


