Stock Market Outlook for March 16, 2026

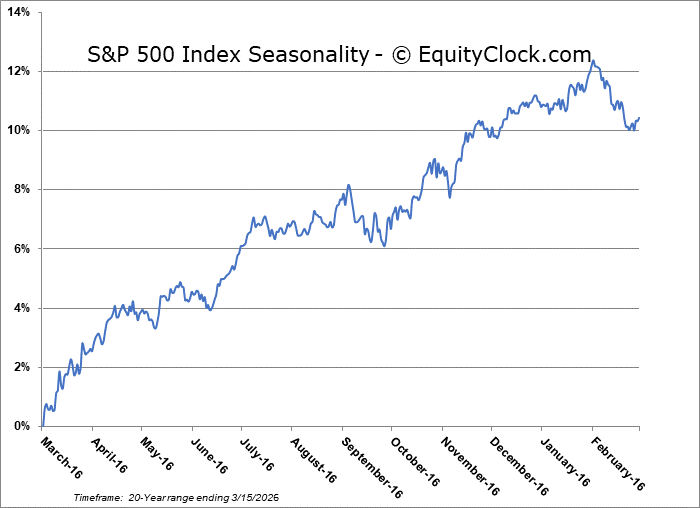
On the lookout for the metrics that would entice us to ramp up risk in portfolios, as is typically appropriate heading into the end of March and through the month of April.
*** Stocks highlighted are for information purposes only and should not be considered as advice to purchase or to sell mentioned securities. As always, the use of technical and fundamental analysis is encouraged in order to fine tune entry and exit points to average seasonal trends.
Stocks Entering Period of Seasonal Strength Today:
Subscribers Click on the relevant link to view the full profile. Not a subscriber? Signup here.

Oracle Corp. (NYSE:ORCL) Seasonal Chart

Bentley Systems, Inc. (NASD:BSY) Seasonal Chart

Rentokil Initial plc (NYSE:RTO) Seasonal Chart

iShares MSCI ACWI ETF (NASD:ACWI) Seasonal Chart
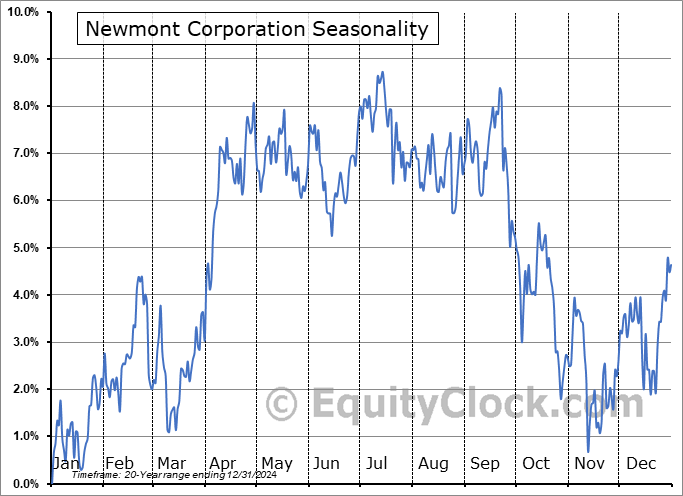
Newmont Corporation (NYSE:NEM) Seasonal Chart

Talos Energy, Inc. (NYSE:TALO) Seasonal Chart

Tortoise Power & Energy Infrastructure Fund Inc. (NYSE:TPZ) Seasonal Chart

Empire Co. Ltd. (TSE:EMP/A.TO) Seasonal Chart

Birchcliff Energy Limited (TSE:BIR.TO) Seasonal Chart

ARC Resources Ltd. (TSE:ARX.TO) Seasonal Chart
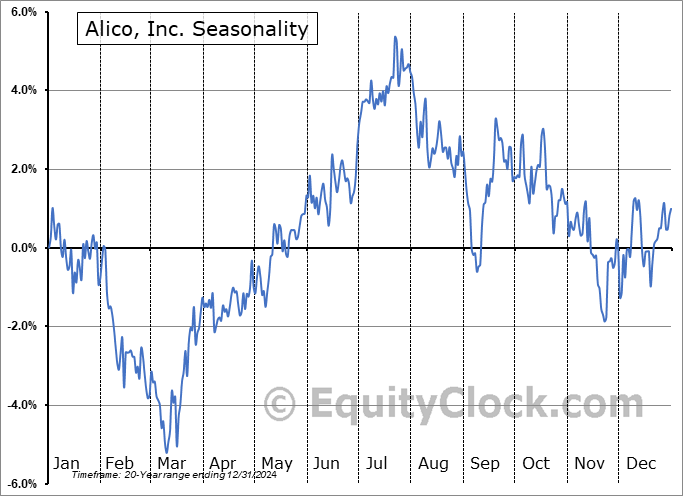
Alico, Inc. (NASD:ALCO) Seasonal Chart

Invesco S&P Spin-Off ETF (NYSE:CSD) Seasonal Chart

Welltower Inc. (NYSE:WELL) Seasonal Chart

APA Corporation (NASD:APA) Seasonal Chart

Ecopetrol SA (NYSE:EC) Seasonal Chart
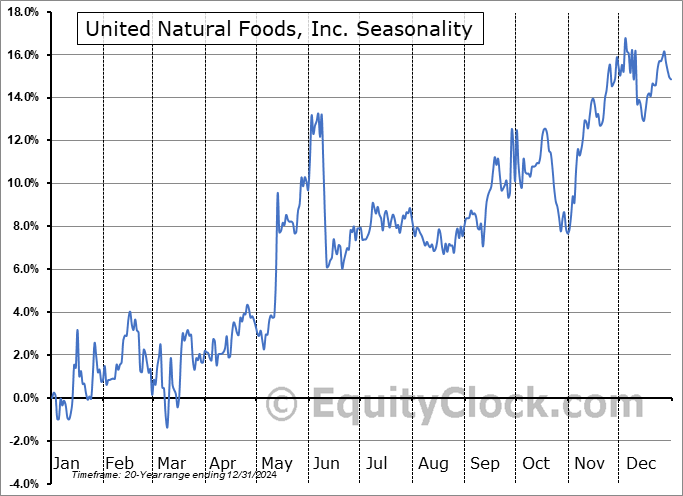
United Natural Foods, Inc. (NYSE:UNFI) Seasonal Chart
Disclaimer: Comments and opinions offered in this report are for information only. They should not be considered as advice to purchase or to sell mentioned securities. Data offered is believed to be accurate, but is not guaranteed.
The Markets
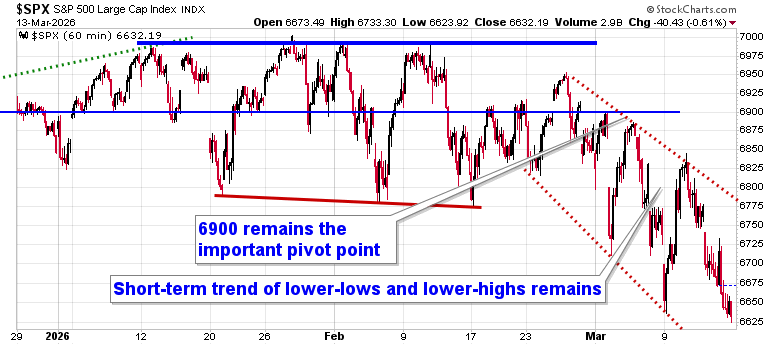
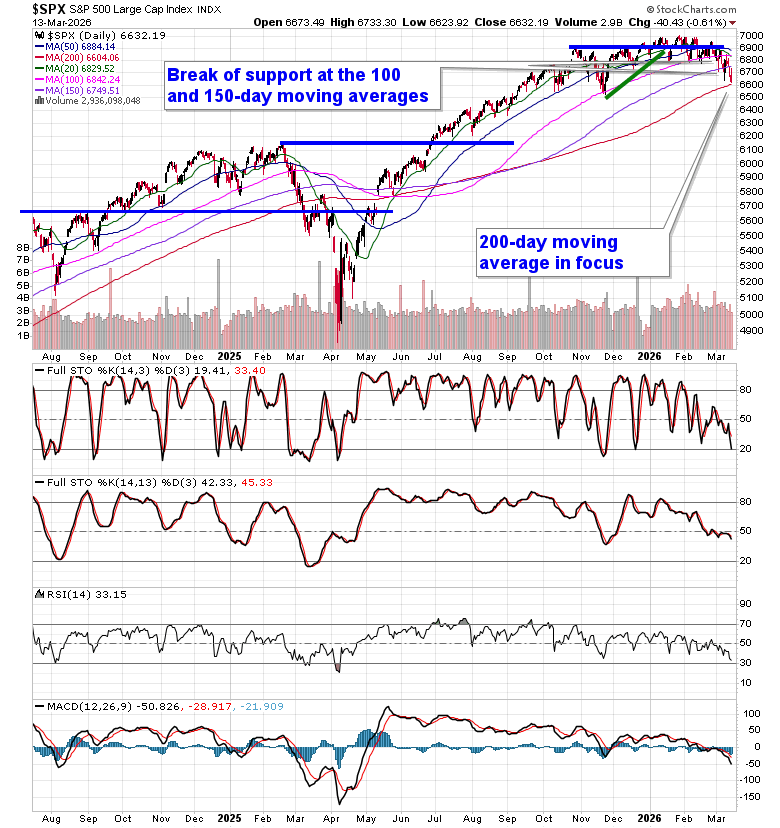
Markets continued to stumble through the Friday session as uncertainty over what the headlines may reveal over the weekend pertaining to the conflict in Iran had traders trimming risk. The S&P 500 Index closed down by six-tenths of one percent, closing at a new year-to-date low. The index continues to trade below the important 6900 pivot point that we have highlighted in our reporting and an ultra-short-term trend of lower-highs and lower-lows remains intact. Levels of resistance overhead remain heavy and it remains premature to conclude, with confidence, that we have exited this normally volatile phase for stocks between the middle of February and the middle of March. The 100 and 150-day moving averages for the large-cap benchmark at 6842 and 6749, respectively, have been broken; our focus is on the 200-day moving average (6604), which is mere points away . A band between 6500 and 6600 should cause the bears to think twice about pressing negative bets, in the short-term, but, if this zone does break, we will have a longer-term topping pattern on the chart that stretches back many months to contend with. The speculative side of us (which we are not acting on, rather just entertaining) suggests that we hold the zone of support into the period of seasonal positivity for equity markets during the end of March and through the month of April, but ongoing strains ahead threatens the longer-term technical profile once the offseason for stocks gets underway in late April/early May. In the Seasonal Advantage Portfolio that we manage for clients at CastleMoore, we continue to balance the near-term risk-reward in the market, barbelling low volatility plays with pro-cyclical/commodity oriented bets, an approach that continues align with the trends in the market. Our desire is to still ramp up risk exposure again at more favourable levels for the strength that is normal of equity markets through the weeks ahead, playing the tail-end of the best six months of the year for stocks. It is what the market may deliver beyond this traditionally positive timeframe that is up for debate, but we have some ideas. Subscribers can view the themes in our chart books to either Accumulate or Avoid that are working and intact.
Today, in our Market Outlook to subscribers, we discuss the following:
- Equity Market Outlook & Technical Levels
- Weekly Trend Signals
- Market Rotation: Growth → Cyclicals → Defensives
- Deteriorating Market Breadth
- Macro Drivers: Yields & Dollar
- Volatility Signals
- Canadian Economic Concerns
- Sector Signals from Employment Data
- Investor Sentiment
Subscribers can look for this report in their inbox or by clicking on the following link and logging in: Market Outlook for March 16
Not signed up yet? Subscribe now to receive full access to all of the research and analysis that we publish
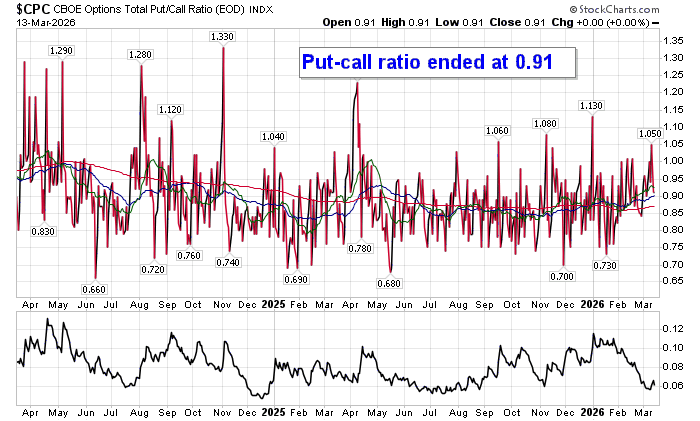
Sentiment on Friday, as gauged by the put-call ratio, ended bullish at 0.91.
Seasonal charts of companies reporting earnings today:


S&P 500 Index
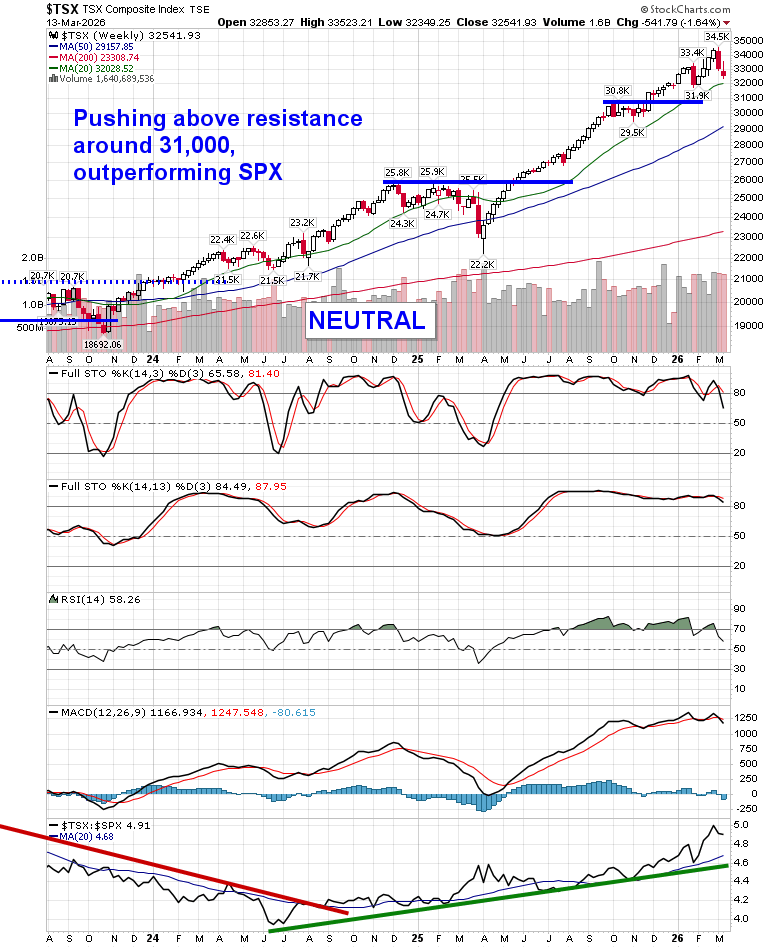
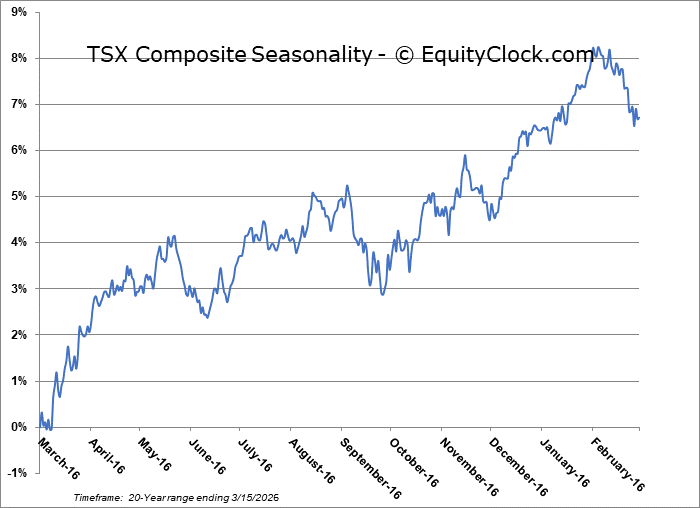
TSE Composite
| Sponsored By... |

|


