Stock Market Outlook for March 17, 2026

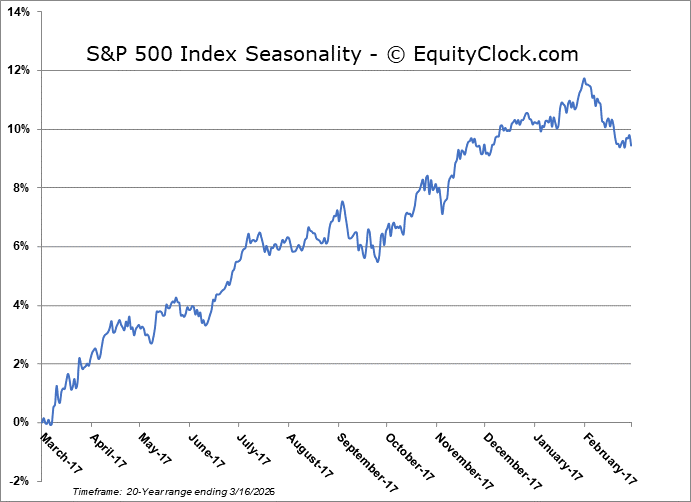
Market needs to hold Monday’s upside gap to allow the normal seasonal rise in stocks to proceed from here.
*** Stocks highlighted are for information purposes only and should not be considered as advice to purchase or to sell mentioned securities. As always, the use of technical and fundamental analysis is encouraged in order to fine tune entry and exit points to average seasonal trends.
Stocks Entering Period of Seasonal Strength Today:
Subscribers Click on the relevant link to view the full profile. Not a subscriber? Signup here.
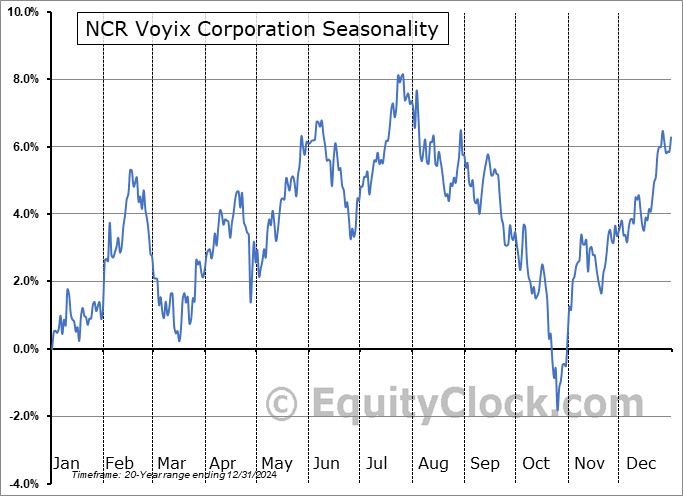
NCR Voyix Corporation (NYSE:VYX) Seasonal Chart

Shell Plc (NYSE:SHEL) Seasonal Chart

Tortoise North American Pipeline Fund (NYSE:TPYP) Seasonal Chart

CareTrust REIT, Inc. (NYSE:CTRE) Seasonal Chart

Restaurant Brands International Inc. (NYSE:QSR) Seasonal Chart

Constellation Brands, Inc. (NYSE:STZ) Seasonal Chart

ADMA Biologics, Inc. (NASD:ADMA) Seasonal Chart

Matador Resources Co. (NYSE:MTDR) Seasonal Chart

Permianville Royalty Trust (NYSE:PVL) Seasonal Chart

Invesco S&P Emerging Markets Momentum ETF (AMEX:EEMO) Seasonal Chart
Disclaimer: Comments and opinions offered in this report are for information only. They should not be considered as advice to purchase or to sell mentioned securities. Data offered is believed to be accurate, but is not guaranteed.
The Markets
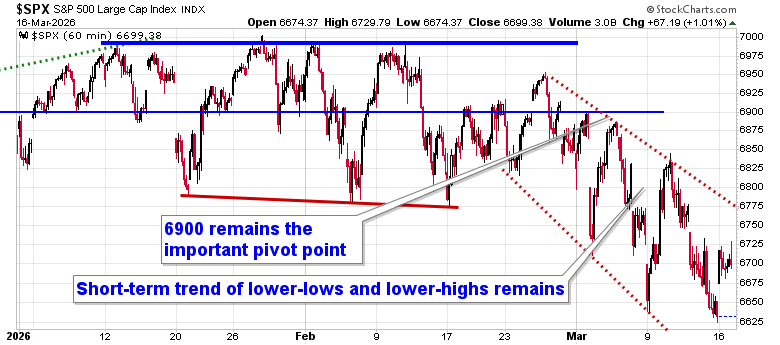
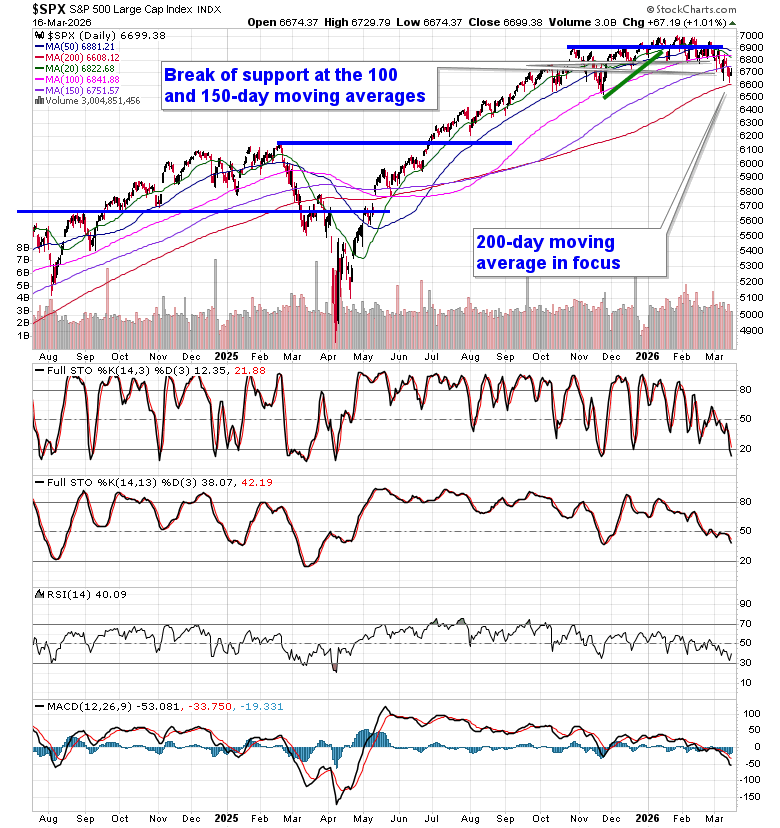
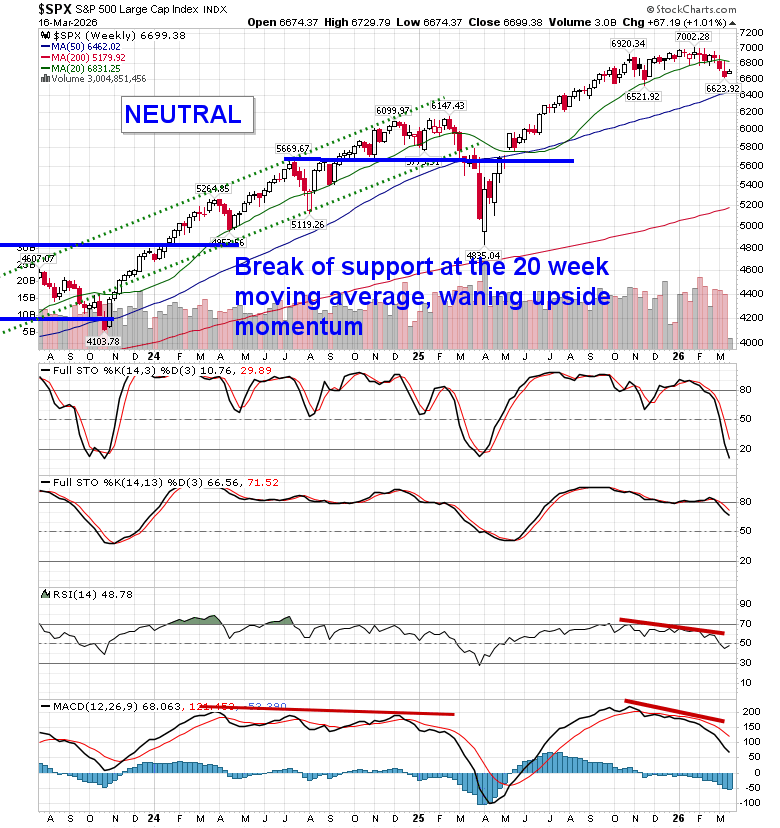
Markets recovered into the start of the new week as the price of Oil declined from its highs given a lack of escalation of tensions in Iran over the weekend. The S&P 500 Index closed higher by just over one percent, trading off of the year-to-date low that was charted on Friday. An upside gap was recorded around 6650 and the ability to hold this level through the sessions ahead will be key to determining if ramping up risk for the period of seasonal strength in the equity markets is appropriate. The index continues to trade below the important 6900 pivot point that we have highlighted in our reporting and an ultra-short-term declining trend remains intact. The 100 and 150-day moving averages for the large-cap benchmark at 6841 and 6751, respectively, have been broken and the 200-day moving average (6608), which was mere points away at Friday’s low, is critical to hold. As has been highlighted in our reporting, it would be difficult for the benchmark to slip below a range between 6500 and 6600 given the positive seasonality that is upon us, but, if this zone does break, we will have a longer-term topping pattern on the chart that stretches back many months to contend with. The speculative side of us (which we are not acting on, rather just entertaining) suggests that we hold the zone of support into the period of seasonal positivity for equity markets during the end of March and through the month of April, but ongoing strains ahead threatens the longer-term technical profile once the offseason for stocks gets underway in late April/early May. In the Seasonal Advantage Portfolio that we manage for clients at CastleMoore, we have been balancing the near-term risk-reward in the market, barbelling low volatility plays with pro-cyclical/commodity oriented bets, an approach that continues align with the trends in the market, but we are looking for our spot to ramp up risk exposure again, when the risk-reward makes sense. Subscribers can view the themes in our chart books to either Accumulate or Avoid that are working and intact.
Want to know which areas of the market to buy or sell? Our Weekly Chart Books have just been updated, providing a clear Accumulate, Avoid, or Neutral rating for currencies, cryptocurrencies, commodities, broad markets, and subsectors/industries of the market. Subscribers can login and click on the relevant links to access.
- Currencies
- Cryptocurrencies
- Commodities
- Major Benchmarks
- Sub-sectors / Industries
- ETFs: Bonds | Commodities | Equity Markets | Industries | Sectors
Subscribe now.
Today, in our Market Outlook to subscribers, we discuss the following:
- Market Rebound but Key Resistance Remains
- Seasonal Tailwinds for Stocks
- Portfolio Positioning
- Macro Cues to the Success of the Seasonal Rally in Stocks
- Volatility & Oil Risk
- Our chart books ratings changes: Find out what joins our list of Accumulate candidates this week
- Other Notes
Subscribers can look for this report in their inbox or by clicking on the following link and logging in: Market Outlook for March 17
Not signed up yet? Subscribe now to receive full access to all of the research and analysis that we publish
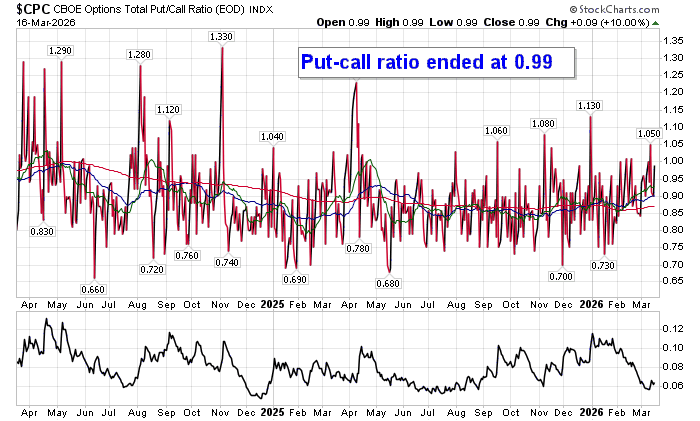
Sentiment on Monday, as gauged by the put-call ratio, ended close to Neutral at 0.99.
Seasonal charts of companies reporting earnings today:


S&P 500 Index
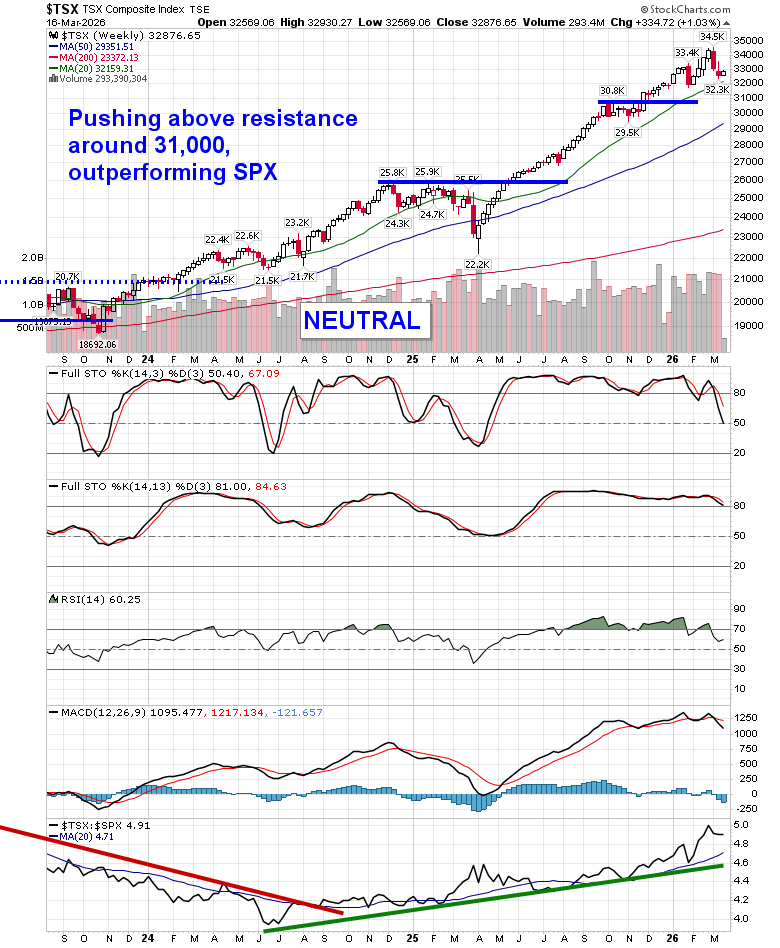
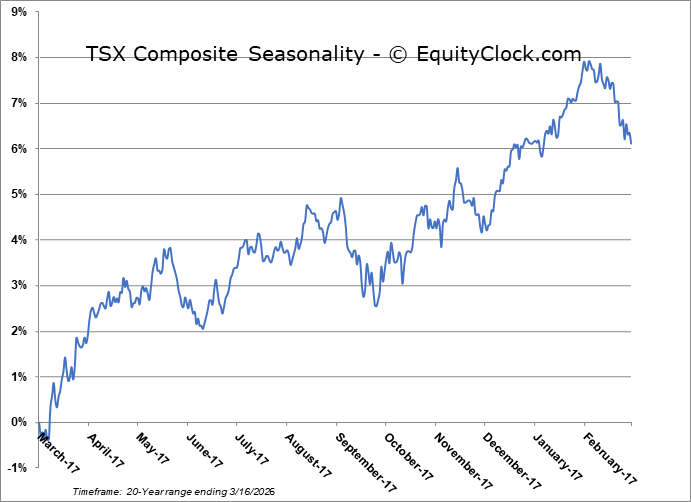
TSE Composite
| Sponsored By... |

|


