Stock Market Outlook for March 18, 2026

The latest read of Industrial Production in the US attests that the Manufacturing Renaissance into the spring is real, enticing exposure in portfolios to the groups that are exposed.
*** Stocks highlighted are for information purposes only and should not be considered as advice to purchase or to sell mentioned securities. As always, the use of technical and fundamental analysis is encouraged in order to fine tune entry and exit points to average seasonal trends.
Stocks Entering Period of Seasonal Strength Today:
Subscribers Click on the relevant link to view the full profile. Not a subscriber? Signup here.

Blackrock Utility and Infrastructure Trust (NYSE:BUI) Seasonal Chart

Nuveen Multi-Strategy Income and Growth Fund (NYSE:JPC) Seasonal Chart

VanEck High Yield Muni ETF (NYSE:HYD) Seasonal Chart

VanEck Brazil Small-Cap ETF (NYSE:BRF) Seasonal Chart

Farmland Partners Inc. (NYSE:FPI) Seasonal Chart

Installed Building Products Inc. (NYSE:IBP) Seasonal Chart

Reaves Utility Income Trust (AMEX:UTG) Seasonal Chart

Anheuser-Busch InBev ADR (NYSE:BUD) Seasonal Chart

Oil States Intl (NYSE:OIS) Seasonal Chart

Oneok, Inc. (NYSE:OKE) Seasonal Chart

W&T Offshore Inc. (NYSE:WTI) Seasonal Chart

Williams Cos., Inc. (NYSE:WMB) Seasonal Chart

DTE Energy Co. (NYSE:DTE) Seasonal Chart

Dell Technologies, Inc. (NYSE:DELL) Seasonal Chart

ConocoPhillips (NYSE:COP) Seasonal Chart
Disclaimer: Comments and opinions offered in this report are for information only. They should not be considered as advice to purchase or to sell mentioned securities. Data offered is believed to be accurate, but is not guaranteed.
The Markets
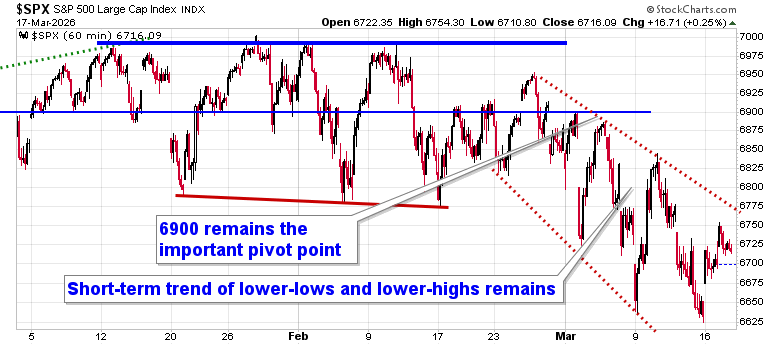
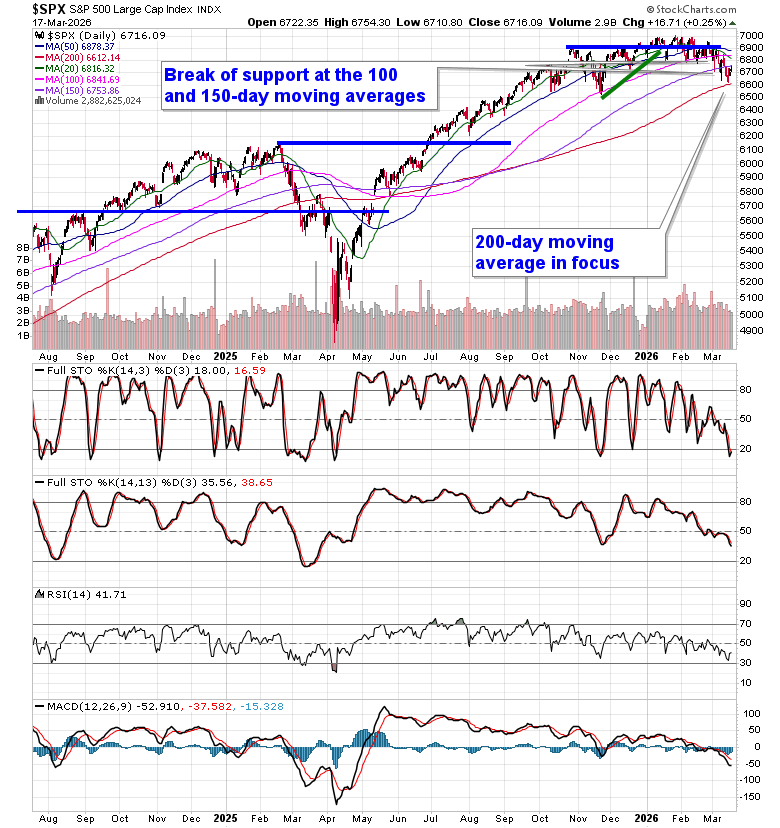
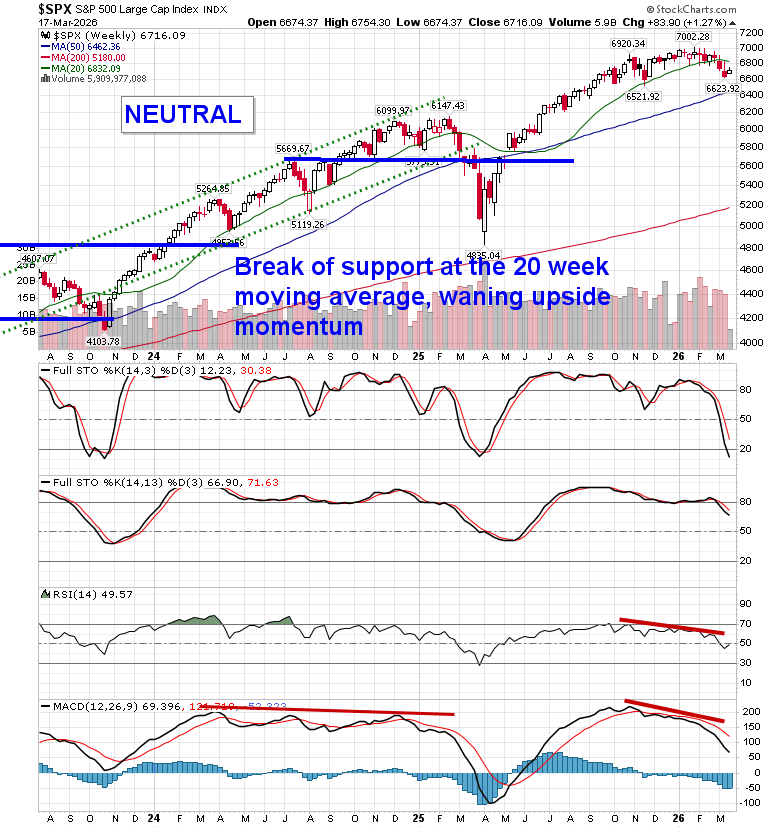
Equity markets inched higher on Tuesday as interest rates and the dollar drifted off of their recent highs, despite a firmer price of oil. The S&P 500 Index ended with a gain of a quarter of one percent, trading off of the year-to-date low that was recorded on Friday. An upside gap charted on Monday around 6650 remains unfilled and the ability to hold this level through the sessions ahead will be key to determining if ramping up risk for the period of seasonal strength in the equity markets is appropriate. The index continues to trade below the important 6900 pivot point that we have highlighted in our reporting and an ultra-short-term declining trend remains intact. The 100 and 150-day moving averages for the large-cap benchmark at 6841 and 6753, respectively, have been broken and the 200-day moving average (6612), which was mere points away at Friday’s low, is critical to hold. As has been highlighted in our reporting, it would be difficult for the benchmark to slip below a range between 6500 and 6600 given the positive seasonality that is upon us, but, if this zone does break, we will have a longer-term topping pattern on the chart that stretches back many months to contend with. The speculative side of us (which we are not acting on, rather just entertaining) suggests that we hold the zone of support into the period of seasonal positivity for equity markets during the end of March and through the month of April, but ongoing strains ahead threatens the longer-term technical profile once the offseason for stocks gets underway in late April/early May. In the Seasonal Advantage Portfolio that we manage for clients at CastleMoore, we have been balancing the near-term risk-reward in the market, barbelling low volatility plays with pro-cyclical/commodity oriented bets, an approach that continues align with the trends in the market, but we are looking for our spot to ramp up risk exposure again, when the risk-reward makes sense. Subscribers can view the themes in our chart books to either Accumulate or Avoid that are working and intact.
Today, in our Market Outlook to subscribers, we discuss the following:
- Market Bounce, But Trend Still Fragile
- Portfolio Strategy
- Market Regime Continues to Favor Value Over Growth
- Technology: Key Risk and Future Opportunity
- Manufacturing Renaissance Gaining Strength
- Sentiment: Alleviating its Bullish Tilt, But not yet at an Extreme
- Macro Backdrop: Slight Relief
Subscribers can look for this report in their inbox or by clicking on the following link and logging in: Market Outlook for March 18
Not signed up yet? Subscribe now to receive full access to all of the research and analysis that we publish
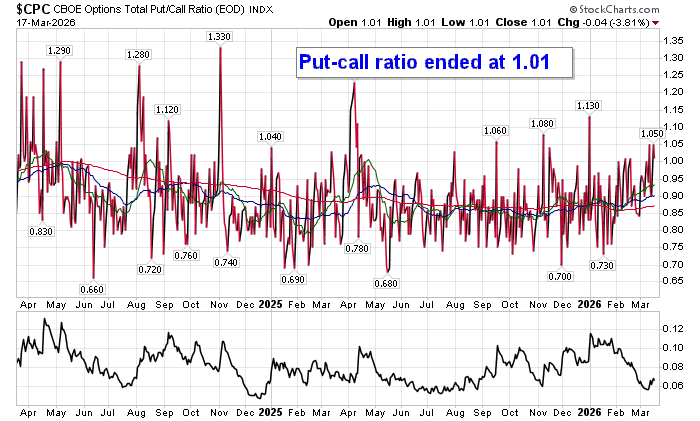
Sentiment on Tuesday, as gauged by the put-call ratio, ended slightly bearish at 1.01.
Seasonal charts of companies reporting earnings today:


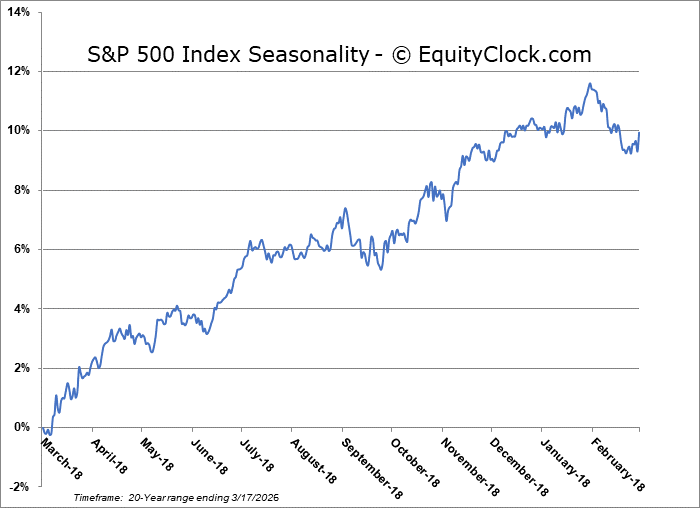
S&P 500 Index
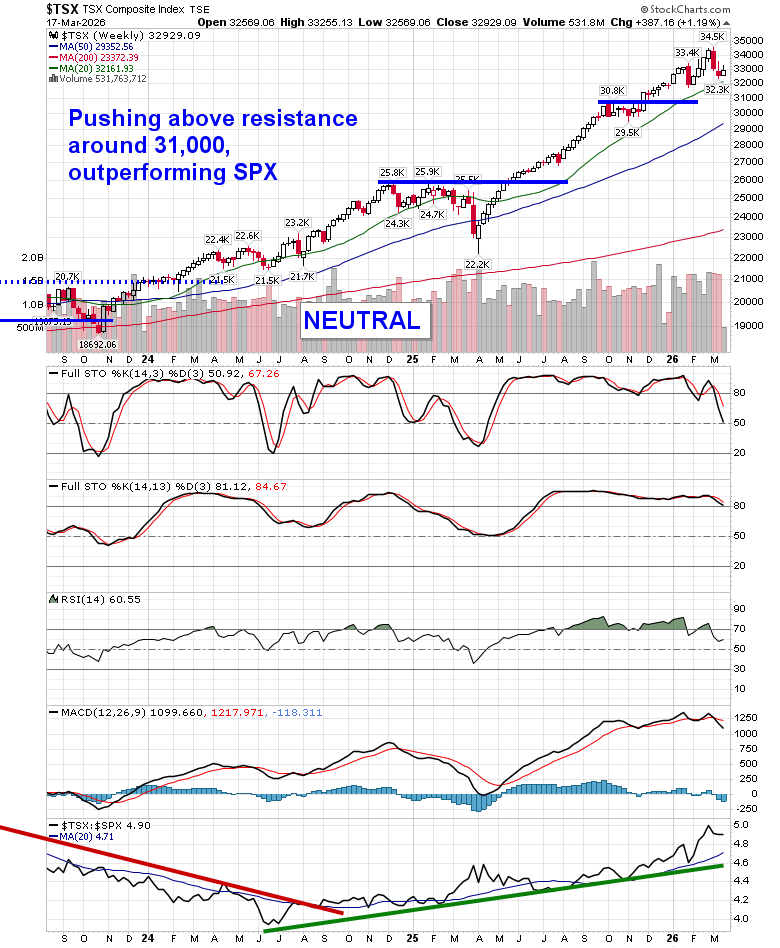
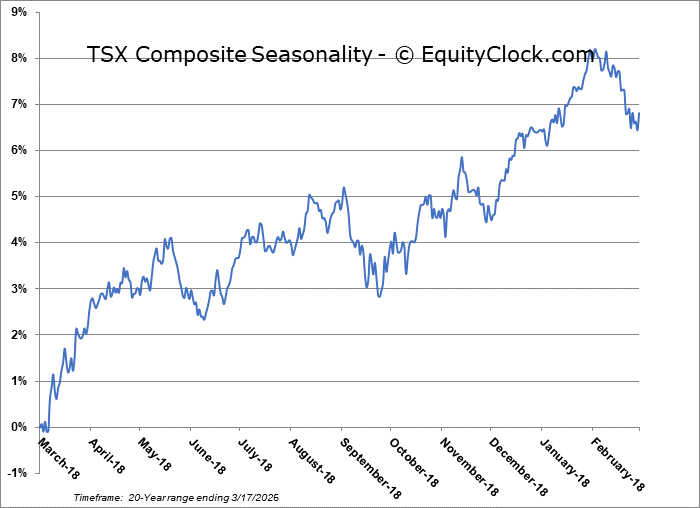
TSE Composite
| Sponsored By... |

|


